Spectrum Brands (SPB) Q4 Earnings Top Estimates, Sales Lag
Spectrum Brands Holdings Inc. SPB reported fourth-quarter fiscal 2023 results, wherein the bottom line surpassed the Zacks Consensus Estimate, while sales missed the same. Results gained from cost improvements, the exit of non-core unproductive categories, reduced inventory and improving fill rates across all businesses. The company also increased investments in marketing and advertising in the fiscal fourth quarter.
Shares of the Zacks Rank #2 (Buy) company have gained 13.2% year to date against the industry's decline of 14.1%.
Q4 Highlights
SPB reported adjusted earnings of $1.36 per share, up 183.3% year over year and surpassed the Zacks Consensus Estimate of $1.14. This upside is mainly attributable to higher adjusted EBITDA, reduced interest expenses and a lower outstanding share.
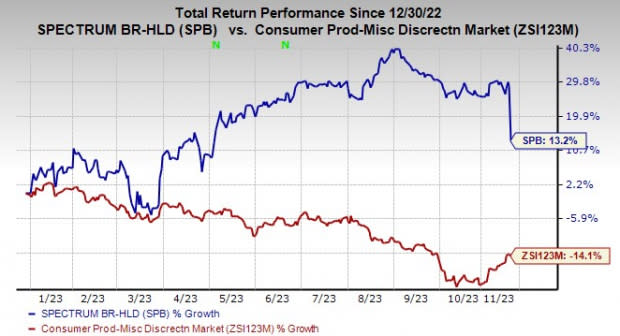
Image Source: Zacks Investment Research
Spectrum Brands' net sales fell 1.2% year over year to $740.7 million and lagged the Zacks Consensus Estimate of $760 million. This was due to continued soft demand for kitchen appliances and the adverse impacts of exiting non-strategic categories in the GPC business. However, favorable foreign currency impacts of $11.3 million acted as a tailwind.
The gross profit increased 2% year over year to $244.4 million, driven by improved pricing and cost improvements, which partly offset currency headwinds. The metric beat our estimate of $235.2 million. Meanwhile, the gross margin expanded 2100 bps to 33%.
SG&A expenses inched up 0.3% to $222.3 million and lagged our estimate of $223.2 million. As a percentage of sales, SG&A expenses expanded 40 bps to 30%.
The company’s operating income fell 1.2% year over year to $16.2 million due to lower volumes, somewhat offset by gross profit improvements, reduced operating spend and lower project spend on restructuring and integration.
Adjusted EBITDA advanced 52% year over year to $113.7 million in the fiscal fourth quarter and surpassed our estimate of $90.9 million. The adjusted EBITDA margin expanded 540 bps to 15.4%, driven by better gross margins and interest income.
Segmental Performance
Sales in the Home & Personal Care segment decreased 6.3% year over year to $323.1 million due to a category decline from lower demand, particularly in kitchen appliances, and continued retailer inventory management in North America. On the flip side, higher sales in personal care and garment care categories acted as tailwinds. The metric came below our estimate of $324 million. Excluding the $4.8 million impact of adverse currency rates, organic net sales for the segment fell 7.7%.
The segment's adjusted EBITDA declined 27.5% year over year to $20.3 million. Meanwhile, the adjusted EBITDA margin contracted 180 bps year over year to 6.3% due to lower volume and unfavorable foreign currency.
The Global Pet Care segment's sales moved up 1.6% year over year to $292.4 million, driven by positive price and favorable foreign currency impacts, somewhat offset by lower volumes, particularly in the slower aquatic unit.
Also, its companion animals category performed well in the EMEA. Sales lagged our estimate of $320.2 million. Excluding the $6.5-million impact of unfavorable foreign currency, organic sales fell 0.7%.
The segment's adjusted EBITDA grew 10.5% year over year to $53.5 per share, while the adjusted EBITDA margin expanded 150 bps year over year to 18.3%, driven by lower distribution costs, positive pricing, a favorable mix from the decision to exit non-strategic SKUs, savings from the prior year’s cost-reduction initiatives and lower freight costs, partly offset by lower volumes in aquatics.
The Home & Garden segment's sales rose 7.2% year over year to $125.2 million, driven by commercial investments and favorable weather resulting in POS growth in the controls and household repellent categories. Spectracide and Hot Shot brands witnessed double-digit POS growth on the back of increased advertising spend, leading to higher replenishment orders. The metric exceeded our estimate of $109.6 million.
The segment's adjusted EBITDA of $21 million increased 60.3% from $13.1 million in the prior-year quarter, driven by higher volumes, fixed cost absorption and cost-saving actions. On the flip side, higher product costs from raw material and labor acted as headwinds. The adjusted EBITDA margin expanded 560 bps to 16.8%.
Other Financials
As of Sep 30, 2023, the company’s cash balance was $754 million, with an outstanding debt of $1,574 million. Following the fiscal fourth quarter, SPB paid out an additional $1,488 million of senior unsecured notes and $86 million of finance lease obligations.
Spectrum Brands Holdings Inc. Price, Consensus and EPS Surprise
Spectrum Brands Holdings Inc. price-consensus-eps-surprise-chart | Spectrum Brands Holdings Inc. Quote
Guidance
Spectrum Brands issued its guidance for fiscal 2024. The company expects a low-single-digit sales decline. This includes the adverse impacts of foreign currency. Adjusted EBITDA is likely to grow in the high-single digits. It also expects the macro-economic environment to remain drab and result in top-line pressure, particularly in our Home and Personal Care business.
Stocks to Consider
Some better-ranked companies are MGM Resorts MGM, Guess GES and lululemon athletica LULU.
Guess currently sports a Zacks Rank of 1 (Strong Buy). GES has a trailing four-quarter earnings surprise of 43.4%, on average. You can see the complete list of today’s Zacks #1 Rank stocks here.
The Zacks Consensus Estimate for GES’ fiscal 2023 sales and EPS implies improvements of 3.4% and 9.9%, respectively, from the year-ago period’s reported levels.
MGM Resorts currently carries a Zacks Rank #2 (Buy). The company has a trailing four-quarter earnings surprise of 81%, on average.
The Zacks Consensus Estimate for MGM’s 2024 sales and EPS indicates year-over-year increases of 2.2% and 31%, respectively.
lululemon athletica, a yoga-inspired athletic apparel company, carries a Zacks Rank of 2 at present. LULU has a trailing four-quarter earnings surprise of 9.9%, on average.
The Zacks Consensus Estimate for lululemon athletica’s current financial-year sales and EPS suggests growth of 17% and 18.4%, respectively, from the year-ago reported figures.
Want the latest recommendations from Zacks Investment Research? Today, you can download 7 Best Stocks for the Next 30 Days. Click to get this free report
MGM Resorts International (MGM) : Free Stock Analysis Report
Guess?, Inc. (GES) : Free Stock Analysis Report
lululemon athletica inc. (LULU) : Free Stock Analysis Report
Spectrum Brands Holdings Inc. (SPB) : Free Stock Analysis Report
