Spectrum Brands (SPB) Stock Gains as Q3 Earnings Top Estimates
Spectrum Brands Holdings Inc. SPB has reported third-quarter fiscal 2023 results, wherein the bottom line surpassed the Zacks Consensus Estimate, while sales missed the same. Results have been hurt by lower demand, cooler weather that hurt its Home and Garden business, and the DOJ lawsuit to block the sale of the HHI business.
With the sales of the HHI business, the company is now able to refocus on its core businesses and boasts a stronger balance sheet.
Shares of the Zacks Rank #3 (Hold) company have gained 6.3% in the past three months against the industry's decline of 37.9%. Also, SPB shares grew more than 4% before the trading session on Aug 11.
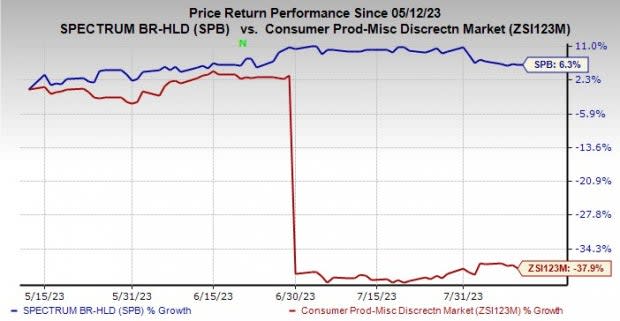
Image Source: Zacks Investment Research
Q3 Highlights
The company reported adjusted earnings of 75 cents per share, up 39% year over year and surpassed the Zacks Consensus Estimate of 57 cents. This upside is mainly attributable to higher adjusted EBITDA and a lower outstanding share.
Spectrum Brands' net sales fell 10% year over year to $735.5 million and lagged the Zacks Consensus Estimate of $781 million. Adverse foreign currency impacts of $3.5 million acted as a drag. Organic net sales declined 9.7%. The downside was mainly due to retailer inventory management strategies and slower category POS, offset by positive pricing.
The gross profit decreased 4.5% year over year to $263.5 million due to reduced volume. The metric came ahead of our estimate of $260.2 million. Meanwhile, the gross margin expanded 210 bps to 35.8%, driven by increased pricing, cost improvements and favorable mix.
SG&A expenses fell 14.9% to $218.1 million and came below our estimate of $242.9 million. As a percentage of sales, SG&A expenses contracted 170 bps to 29.6%.
The company’s operating loss was $124.7 million against the prior-year quarter’s earnings of $38.7 million due to a goodwill impairment of $111.1 million and intangible asset impairment of $53.7 million, offset by lower distribution costs, fixed-cost-reduction efforts, and reduced project spend on restructuring, optimization and strategic transaction initiatives.
Adjusted EBITDA advanced 23% to $98.5 million in the fiscal third quarter and came ahead of our estimate of $89.3 million. The adjusted EBITDA margin expanded 360 bps to 13.4%, driven by lower distribution costs, fixed-cost-reduction initiatives and positive pricing impacts, partly offset by the reduced volume.
Segmental Performance
Sales in the Home & Personal Care segment decreased 16% to $277 million due to a category decline from lower demand, particularly in kitchen appliances, and continued retailer inventory management in North America. The metric came ahead of our estimate of $275.4 million. Excluding the $4.3-million impact of adverse currency rates, organic net sales for the segment fell 14.7%.
The segment's adjusted EBITDA surged 216.7% to $11.4 million. Meanwhile, the adjusted EBITDA margin expanded 300 bps year over year to 4.1%, driven by cost improvement initiatives, positive pricing and ocean freight declines. This was partially offset by unfavorable foreign currency in LATAM and reduced volume.
The Global Pet Care segment's sales moved down 6.2% year over year to $272.3 million due to the continued softness in the global aquatics category. Also, its companion animals category performed well in the EMEA and Latin America regions but declined in North America due to aggressive portfolio management, which led to the exit several non-strategic categories. The metric lagged our estimate of $294.4 million. Excluding the $0.8-million impact of unfavorable foreign currency, organic sales fell 6.4%.
The segment's adjusted EBITDA grew 31% to $53.6, while the adjusted EBITDA margin expanded 560 bps year over year to 19.7%, driven by lower distribution costs, positive pricing, savings from the prior year’s cost-reduction initiatives and additional cost-reduction actions, partly offset by lower volumes.
The Home & Garden segment's sales declined 6% to $186.6 million due to lower-than-expected replenishment orders for the pest control category, lower-than-expected POS and adverse weather conditions. On the flip side, cleaning products’ sales witnessed low-single-digit growth, but the category POS was drab due to the dismal demand for cleaning products post COVID-19 outbreak. The metric lagged our estimate of $204.3 million.
The segment's adjusted EBITDA of $38.6 million decreased 9.8% from $42.8 million in the prior-year quarter due to a sales decline and continued inflation, offset by positive pricing, benefits of the prior year’s fixed-cost restructuring and operational cost reductions from cost improvement initiatives. The adjusted EBITDA margin contracted 90 bps to 20.7%.
Other Financials
As of Jul 2, 2023, the company’s cash balance was $2,930 million, with an outstanding debt of $2,101 million. Following the fiscal third quarter, SPB paid an additional $450 million of senior unsecured notes.
Spectrum Brands Holdings Inc. Price, Consensus and EPS Surprise
Spectrum Brands Holdings Inc. price-consensus-eps-surprise-chart | Spectrum Brands Holdings Inc. Quote
Guidance
Spectrum Brands retained its guidance for fiscal 2023. The company expects a mid-single-digit sales decline. This includes the adverse impacts of foreign currency. Adjusted EBITDA is likely to decline in the low to mid-single digits. It also expects short-term demand headwinds to continue in the fiscal fourth quarter.
Stocks to Consider
Some better-ranked companies are Royal Caribbean RCL, lululemon athletica LULU and G-III Apparel GIII.
Royal Caribbean sports a Zacks Rank #1 (Strong Buy) at present. RCL has a trailing four-quarter earnings surprise of 26.4%, on average. You can see the complete list of today’s Zacks #1 Rank stocks here.
The Zacks Consensus Estimate for RCL’s 2023 sales and EPS indicates increases of 47.9% and 158.3%, respectively, from the year-ago period’s reported levels.
lululemon athletica is a yoga-inspired athletic apparel company. LULU carries a Zacks Rank of 2 (Buy) at present.
The Zacks Consensus Estimate for lululemon athletica’s current financial-year sales and EPS suggests growth of 16.7% and 18%, respectively, from the year-ago reported figures. LULU has a trailing four-quarter earnings surprise of 9.9%, on average.
G-III Apparel is a leading designer and distributor of women's and men's apparel in the United States, which currently carries a Zacks Rank of 2.
The Zacks Consensus Estimate for G-III Apparel’s current financial-year sales suggests growth of 1.9%. Its earnings per share are expected to rise 0.4% from the year-ago reported figure. GIII has a trailing four-quarter earnings surprise of 47.4%, on average.
Want the latest recommendations from Zacks Investment Research? Today, you can download 7 Best Stocks for the Next 30 Days. Click to get this free report
Royal Caribbean Cruises Ltd. (RCL) : Free Stock Analysis Report
lululemon athletica inc. (LULU) : Free Stock Analysis Report
G-III Apparel Group, LTD. (GIII) : Free Stock Analysis Report
Spectrum Brands Holdings Inc. (SPB) : Free Stock Analysis Report
