Is Spirax-Sarco Engineering plc (LON:SPX) A Financially Sound Company?

Small-caps and large-caps are wildly popular among investors, however, mid-cap stocks, such as Spirax-Sarco Engineering plc (LON:SPX), with a market capitalization of UK£5.04b, rarely draw their attention from the investing community. Despite this, commonly overlooked mid-caps have historically produced better risk-adjusted returns than their small and large-cap counterparts. This article will examine SPX’s financial liquidity and debt levels to get an idea of whether the company can deal with cyclical downturns and maintain funds to accommodate strategic spending for future growth. Don’t forget that this is a general and concentrated examination of Spirax-Sarco Engineering’s financial health, so you should conduct further analysis into SPX here.
See our latest analysis for Spirax-Sarco Engineering
How much cash does SPX generate through its operations?
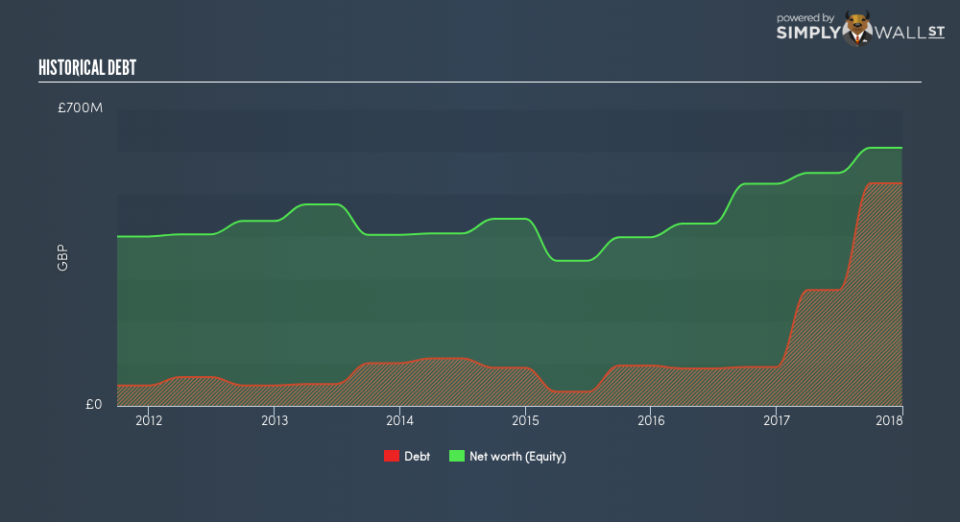
Over the past year, SPX has ramped up its debt from UK£91.80m to UK£525.70m , which comprises of short- and long-term debt. With this increase in debt, SPX’s cash and short-term investments stands at UK£152.10m for investing into the business. On top of this, SPX has generated cash from operations of UK£159.40m over the same time period, leading to an operating cash to total debt ratio of 30.32%, meaning that SPX’s operating cash is sufficient to cover its debt. This ratio can also be a sign of operational efficiency as an alternative to return on assets. In SPX’s case, it is able to generate 0.3x cash from its debt capital.
Can SPX pay its short-term liabilities?
With current liabilities at UK£246.70m, it appears that the company has been able to meet these obligations given the level of current assets of UK£575.20m, with a current ratio of 2.33x. Usually, for Machinery companies, this is a suitable ratio since there is a bit of a cash buffer without leaving too much capital in a low-return environment.
Does SPX face the risk of succumbing to its debt-load?
SPX is a relatively highly levered company with a debt-to-equity of 86.25%. This is not uncommon for a mid-cap company given that debt tends to be lower-cost and at times, more accessible. No matter how high the company’s debt, if it can easily cover the interest payments, it’s considered to be efficient with its use of excess leverage. A company generating earnings after interest and tax at least three times its net interest payments is considered financially sound. In SPX’s case, the ratio of 55.67x suggests that interest is comfortably covered, which means that debtors may be willing to loan the company more money, giving SPX ample headroom to grow its debt facilities.
Next Steps:
Although SPX’s debt level is towards the higher end of the spectrum, its cash flow coverage seems adequate to meet obligations which means its debt is being efficiently utilised. Since there is also no concerns around SPX’s liquidity needs, this may be its optimal capital structure for the time being. I admit this is a fairly basic analysis for SPX’s financial health. Other important fundamentals need to be considered alongside. You should continue to research Spirax-Sarco Engineering to get a more holistic view of the mid-cap by looking at:
Future Outlook: What are well-informed industry analysts predicting for SPX’s future growth? Take a look at our free research report of analyst consensus for SPX’s outlook.
Valuation: What is SPX worth today? Is the stock undervalued, even when its growth outlook is factored into its intrinsic value? The intrinsic value infographic in our free research report helps visualize whether SPX is currently mispriced by the market.
Other High-Performing Stocks: Are there other stocks that provide better prospects with proven track records? Explore our free list of these great stocks here.
To help readers see past the short term volatility of the financial market, we aim to bring you a long-term focused research analysis purely driven by fundamental data. Note that our analysis does not factor in the latest price-sensitive company announcements.
The author is an independent contributor and at the time of publication had no position in the stocks mentioned. For errors that warrant correction please contact the editor at editorial-team@simplywallst.com.
