SSR Mining Issues Multi-year Guidance and Technical Reports for All Operating Assets Featuring Production Growth Approaching 800,000 Ounces by 2027 at AISC Trending Towards $1,300 Per Ounce

MULTI-YEAR GUIDANCE (1)
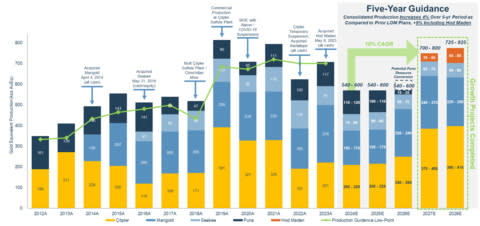
TOTAL 5-YEAR PRODUCTION INCREASES 4% OVER PRIOR LIFE OF MINE PLANS TO 3.1 MILLION OUNCES GOLD EQUIVALENT, AND INCREASES 9% INCLUDING CONTRIBUTIONS FROM THE HOD MADEN ACQUISITION
PRODUCTION PLATFORM APPROACHES 800,000 GOLD EQUIVALENT OUNCES BY 2027, A 10% CAGR
AISC EXPECTED TO MEANINGFULLY IMPROVE, TRENDING TOWARDS $1,300 PER OUNCE BY 2027 AND DRIVING SECTOR LEADING FREE CASH FLOWS
POSITIVE FREE CASH FLOW EXPECTED IN 2024, BUILDING FURTHER ON EXISTING $1 BILLION LIQUIDITY POSITION
PEER LEADING CAPITAL RETURNS YIELD AND OVERALL RETURNS STRATEGY EXPECTED TO REMAIN UNCHANGED
HOD MADEN ON TRACK FOR POSITIVE CONSTRUCTION DECISION MID-2024; EXPECTED TO DELIVER A +30% PROJECT IRR
TECHNICAL REPORT SUMMARIES ("TRS")
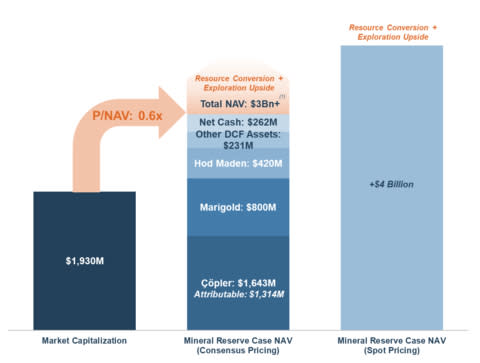
CORPORATE NET ASSET VALUE BASED ON MINERAL RESERVE ONLY TECHNICAL REPORTS OF GREATER THAN $3 BILLION, OR APPROXIMATELY US$15 PER SHARE AT CONSENSUS COMMODITY PRICES, INCREASING TO GREATER THAN $4 BILLION, OR APPROXIMATELY US$20 PER SHARE AT SPOT COMMODITY PRICES
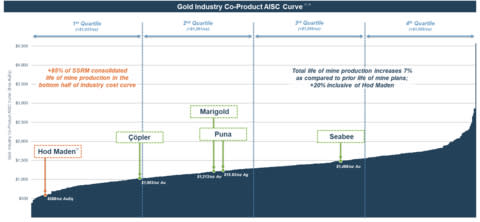
TOTAL LIFE OF MINE PRODUCTION INCREASES OVER PRIOR TECHNICAL REPORTS BY 7% AND 23% RESPECTIVELY, BEFORE AND AFTER THE INCLUSION OF HOD MADEN
MORE THAN 85% OF CONSOLIDATED LIFE OF MINE PRODUCTION IN BOTTOM HALF OF INDUSTRY COST CURVE
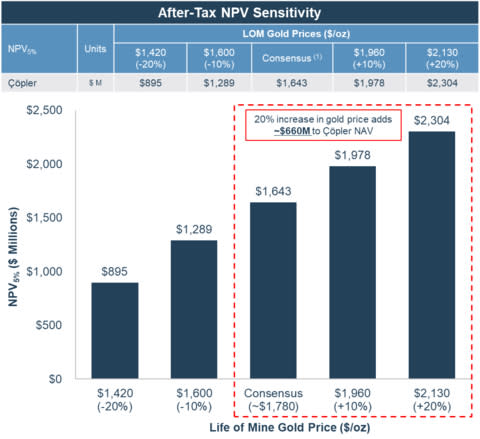
ÇÖPLER TECHNICAL REPORT NET ASSET VALUE OF $1.64 BILLION BASED ON MINERAL RESERVES ONLY
ÇÖPLER AVERAGE ANNUAL PRODUCTION OF 281,000 OUNCES OF GOLD AT AVERAGE COST OF SALES OF $965 PER OUNCE & AISC OF $1,003 PER OUNCE OVER 15 YEARS, GENERATING OPERATING CASH FLOW OF $197 MILLION AND FREE CASH FLOW OF $160 MILLION ANNUALLY OVER LIFE OF MINE
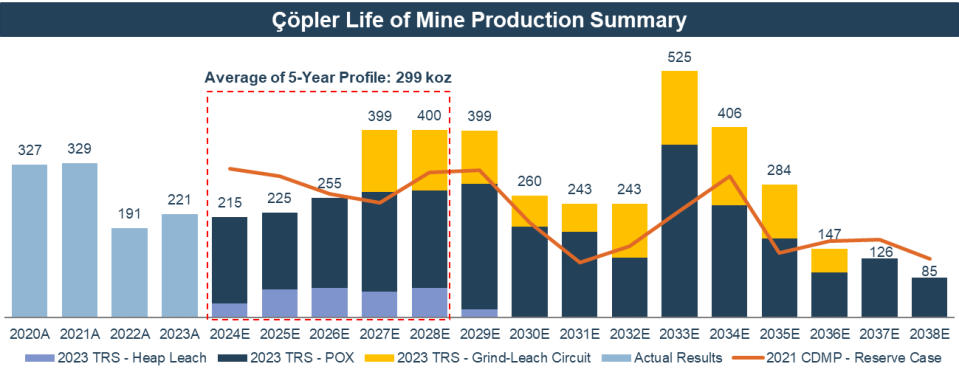
ÇÖPLER GOLD PRODUCTION IS EXPECTED TO INCREASE TO NEARLY 400,000 OUNCES ANNUALLY BY 2027, A 23% CAGR
ÇÖPLER TECHNICAL REPORT INCLUDES +30% IRR GRIND-LEACH CIRCUIT INSTALLATION FOR INITIAL CAPITAL OF $194 MILLION
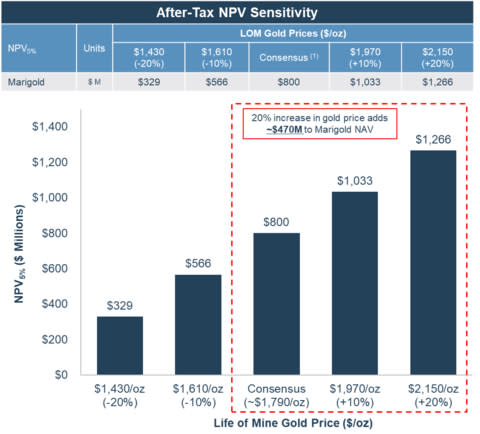
MARIGOLD TECHNICAL REPORT NET ASSET VALUE OF $800 MILLION BASED ON MINERAL RESERVES ONLY
MARIGOLD AVERAGE ANNUAL PRODUCTION OF 212,000 OUNCES OF GOLD AT AVERAGE COST OF SALES OF $1,065 PER OUNCE & AISC OF $1,213 PER OUNCE OVER 9 YEARS, GENERATING OPERATING CASH FLOW OF $124 MILLION AND FREE CASH FLOW OF $95 MILLION ANNUALLY OVER LIFE OF MINE
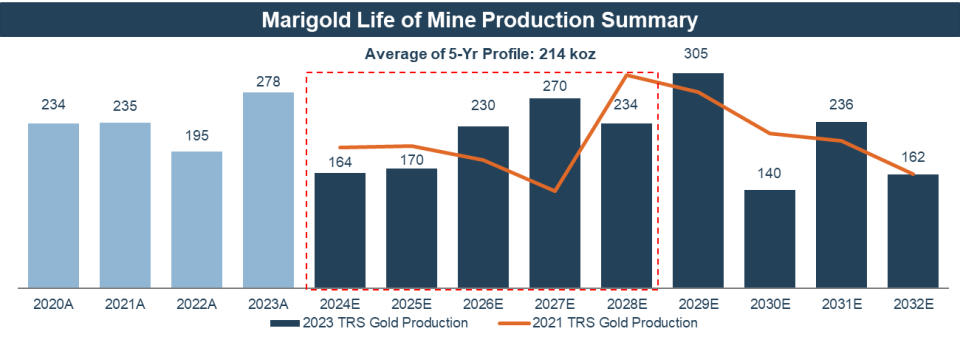
MARIGOLD PRODUCTION PROFILE IS EXPECTED TO EXCEED 300,000 OUNCES IN ANNUAL PRODUCTION BY 2029, A 13% CAGR
YEAR-END 2023 MINERAL RESERVES & MINERAL RESOURCES
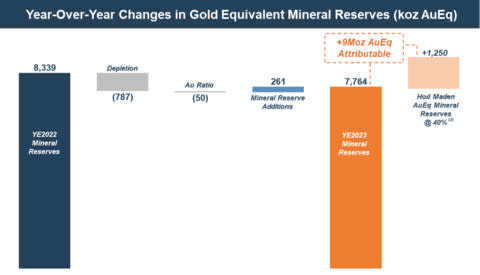
2023 CONSOLIDATED MINERAL RESERVES, ON AN ATTRIBUTABLE BASIS, OF NEARLY 8 MILLION OUNCES GOLD EQUIVALENT
MINERAL RESERVES INCLUDING ATTRIBUTABLE 40% OF HOD MADEN TO EXCEED 9 MILLION OUNCES GOLD EQUIVALENT
PORTFOLIO WEIGHTED AVERAGE MINE LIFE BASED ON MINERAL RESERVES OF AT LEAST 14 YEARS
C2 MINERAL RESOURCES REMOVED FOLLOWING COMPLETION OF TECHNICAL WORK RESULTING IN A $349 MILLION NON-CASH IMPACT TO ÇÖPLER MINERAL PROPERTIES AND FIXED ASSETS VALUE FROM ~$2.80 BILLION TO ~$2.45 BILLION
ÇAKMAKTEPE MINERAL RESERVES INCREASED 75% TO 3 MILLION OUNCES GOLD
DENVER, February 13, 2024--(BUSINESS WIRE)--SSR Mining Inc. (Nasdaq/TSX: SSRM; ASX: SSR) ("SSR Mining" or the "Company") announces a comprehensive and positive business update, including updated life of mine plans and the Company’s production outlook for 2024 through 2028. In 2023, SSR Mining’s four operating assets produced 706,894 gold equivalent ounces at full-year cost of sales of $1,141 per payable ounce and all-in sustaining costs ("AISC") of $1,461 per payable ounce. Fourth quarter 2023 production was 211,226 gold equivalent ounces at cost of sales of $1,064 per payable ounce and AISC of $1,326 per payable ounce.
(1) | The Company reports non-GAAP financial measures including free cash flow and All-In Sustaining Cost ("AISC") per ounce sold (a common measure in the mining industry), to manage and evaluate its operating performance at its mines. See "Cautionary Note Regarding Non-GAAP Financial Measures" for an explanation of these financial measures and a reconciliation of these financial measures to the most comparable GAAP financial measures. |
In 2024, the Company expects to deliver total consolidated production of 540,000 to 600,000 gold equivalent ounces at consolidated cost of sales of $1,300 to $1,350 per payable ounce and AISC of $1,575 to $1,625 per payable ounce. SSR Mining expects production and margins to remain stable at these levels through 2026 as the Company delivers the Grind-Leach Circuit and Hod Maden growth projects, each with an approximately 30% or higher expected after-tax internal rate of return ("IRR"). First production from the two projects is expected in 2027, driving significant production growth towards 800,000 gold equivalent ounces with AISC trending towards $1,300 per ounce by 2027.
Rod Antal, Executive Chairman of SSR Mining, said, "We are pleased with the strong results in the fourth quarter of 2023, successfully delivering on our commitment to produce more than 400,000 gold equivalent ounces in the second half of the year and generating more than $335 million in operating cash flow and $235 million in free cash flow over the same period. Our business has now delivered on its production guidance targets for 11 of the last 12 years, reinforcing our reputation as strong and consistent operators.
This year, we are presenting an extended production guidance outlook, showcasing a strong growth profile approaching 800,000 gold equivalent ounces at AISC trending towards $1,300 per ounce by 2027. This outlook is the culmination of significant technical work and asset optimization efforts across the portfolio, including a nearly 75% increase in Mineral Reserves from Çakmaktepe. The combination of the increase in Mineral Reserves at Çakmaktepe and the concurrent investment in a Grind-Leach Circuit to improve gold recoveries is expected to deliver a doubling of life of mine production from Çakmaktepe, providing a more than 30% expected internal rate of return. Overall, as we’ve optimized our mine plans across the portfolio, we have seen a 7% increase in gold equivalent production as compared to prior life of mine totals, or more than 20% inclusive of Hod Maden.
This company-wide technical work sets a refreshed and positive baseline for our business, with steady production in the near-term and meaningful growth and free cash flow over the five-year period. Our anticipated growth capital expenditures over the next three years are supported by our current liquidity position of nearly $1 billion, our ongoing operating cash flow, and our efforts to finance Hod Maden through a $200 to $300 million project finance facility. Our strong financial position indicates that we will exit this growth cycle with a solid balance sheet while still maintaining our commitment to capital returns. This includes our quarterly cash dividend, which underpins our baseline commitment to capital returns and currently yields nearly 3% annually. In addition, we will continue to supplement these baseline returns through additional share buybacks.
With a weighted average mine life of at least 14 years, a production growth trajectory driven by two of the highest returning projects in the industry, a wealth of additional organic growth opportunities and a continued commitment to capital returns, our business begins 2024 in an enviable position. We look forward to continuing to deliver on our track record of operational consistency, project execution and value accretive strategic initiatives in the years to come."
Full-Year 2024 Outlook & Multi-Year Production Guidance
SSR Mining reports its updated full-year 2024 outlook that includes production and cost guidance by asset and on a consolidated basis. In addition, the Company announces a five-year production guidance outlook, showcasing a strong growth profile over the period.
Table 1: Full-Year 2024 Outlook
Operating Guidance (2) |
| Çöpler (3) | Marigold | Seabee | Puna | Hod Maden (4) | Other | Consolidated | |||||||
Gold Production | koz | 200 — 220 | 155 — 175 | 75 — 85 | — | — | — | 430 — 480 | |||||||
Silver Production | Moz | — | — | — | 8.75 — 9.50 |
|
| 8.75 — 9.50 | |||||||
Gold Equivalent Production | koz | 200 — 220 | 155 — 175 | 75 — 85 | 110 — 120 | — | — | 540 — 600 | |||||||
Cost of Sales per Ounce (5) | $/oz | 1,420 — 1,460 | 1,300 — 1,340 | 990 — 1,030 | 16.50 — 18.00 | — | — | 1,300 — 1,350 | |||||||
Cash Cost per Ounce (6) | $/oz | 1,410 — 1,450 | 1,300 — 1,340 | 990 — 1,030 | 11.50 — 13.00 | — | — | 1,220 — 1,270 | |||||||
Sustaining Capital Expenditures (7) | $M | 29 | 37 | 40 | 17 | — | — | 123 | |||||||
Reclamation Cost Accretion & Amortization | $M | 2 | 3 | 3 | 13 | — | — | 21 | |||||||
General & Administrative | $M | — | — | — | — | — | 60 — 65 | 60 — 65 | |||||||
All-In Sustaining Cost per Ounce (5) | $/oz | 1,550 — 1,590 | 1,535 — 1,575 | 1,495 — 1,535 | 14.75 — 16.25 | — | — | 1,575 — 1,625 | |||||||
Growth Capital | $M | 77 | 1 | 2 | — | 37 | — | 117 | |||||||
Growth Exploration and Resource | $M | 12 | 9 | 15 | 10 | — | 4 | 50 | |||||||
Total Growth Expenditures | $M | 89 | 11 | 17 | 10 | 37 | 4 | 167 |
(2) | Figures may not add due to rounding. | |
(3) | Çöpler figures are reported on a 100% basis. Çöpler is 80% owned by SSR Mining. | |
(4) | Hod Maden figures presented as 40% attributable. Hod Maden is currently 10% owned by SSR Mining. SSR Mining has the option to increase its ownership to 40% through funding of 40% of the pre-production capital commitments and up to $150 million in contingent payments. | |
(5) | Excludes depreciation, depletion, and amortization. | |
(6) | SSR Mining reports the non-GAAP financial measures of cash costs and AISC per payable ounce of gold and silver sold to manage and evaluate operating performance at Çöpler, Marigold, Seabee and Puna. See "Cautionary Note Regarding Non-GAAP Measures" at the end of this press release for an explanation of these financial measures and a reconciliation of these financial measures to cost of sales, previously referred to as production costs, which is the most comparable GAAP financial measures. AISC includes reclamation cost accretion and amortization and certain lease payments. | |
(7) | Includes sustaining exploration and evaluation expenditures. Includes approximately $9 million in lease payments at Çöpler, $1 million of expensed sustaining exploration at Marigold and $24 million in underground mine development at Seabee. | |
(8) | Growth exploration and resource development expenditures are shown on a 100% basis, of which the SSR Mining attributable amount totals $48 million. All growth exploration and resource development spend is expensed. Growth exploration includes project studies and evaluation. |
Table 2: Five-Year Production Outlook
Operating Guidance (9) |
| 2023A | 2024E | 2025E | 2026E | 2027E | 2028E | |||||||
Çöpler (10) | koz Au | 221 | 200 — 220 | 205 — 225 | 240 — 260 | 370 — 400 | 380 — 415 | |||||||
Marigold | koz Au | 278 | 155 — 175 | 155 — 175 | 220 — 240 | 240 — 270 | 220 — 250 | |||||||
Seabee (12) | koz Au | 91 | 75 — 85 | 80 — 90 | 65 — 75 | 65 — 75 | 60 — 80 | |||||||
Puna | Moz Ag | 9.7 | 8.75 — 9.50 | 8.00 — 8.75 | 1.20 — 1.95 | — | — | |||||||
Hod Maden (11) | koz AuEq | — | — | — | — | 25 — 55 | 65 — 80 | |||||||
Gold Equivalent Production | koz AuEq | 707 | 540 — 600 | 540 — 600 | 540 — 600 | 700 — 800 | 725 — 825 |
(9) | Figures may not add due to rounding. | |
(10) | Çöpler figures reported on a 100% basis. Çöpler is 80% owned by SSR Mining. | |
(11) | Hod Maden figures presented as 40% attributable. Hod Maden is currently 10% owned by SSR Mining. SSR Mining has the option to increase its ownership to 40% through funding of 40% of the pre-production capital commitments and up to $150 million in contingent payments during the construction period. | |
(12) | Seabee guidance includes potential Mineral Resource conversion in 2028. |
Guidance Overview (14)
Consolidated production in 2024 is expected to be approximately 60% weighted to the second half of the year, with the strongest consolidated production period in the fourth quarter. This production distribution is driven largely by higher grades and tonnes stacked at Marigold in the second half of 2024. Quarterly AISC is expected to reflect this production profile, with AISC trending well above the full-year 2024 guidance range in the first half reflecting increased waste stripping at Marigold and the timing of spend at Seabee associated with the winter road season. AISC in the second half of 2024 are expected to be below the full-year guidance range. Accordingly, free cash flow generation in 2024 is expected to be strongly weighted to the second half of the year due to aforementioned production weighting and cost profile, as well as annual tax and royalty payments incurred in the first half of 2024. Free cash flow in 2024 is expected to be positive despite initial growth capital spending for Hod Maden and the Grind-Leach Circuit of $117 million.
Çöpler, Türkiye
In 2023, Çöpler produced 220,999 ounces. Gold production was 57,126 ounces in the fourth quarter of 2023, at cost of sales of $1,160 per payable ounce and AISC of $1,535 per payable ounce. In the fourth quarter of 2023, Çöpler recovered approximately 10,000 ounces of gold from Çakmaktepe, which delivered first production late in the third quarter of 2023 in line with guidance. The Çöpler sulfide plant operated at an average throughput rate of nearly 7,500 tonnes per day in 2023 and more than 7,700 tonnes per day in the fourth quarter of 2023, reflecting continued operational improvement efforts.
In 2024, Çöpler is expected to produce 200,000 to 220,000 ounces of gold at mine site cost of sales of $1,420 to $1,460 per payable ounce and AISC of $1,550 to $1,590 per payable ounce. The expected production profile at Çöpler is approximately 55% weighted to the first half of 2024, reflecting higher grades as well as planned maintenance in the fourth quarter. Heap leach production in 2024 is expected to total approximately 40,000 ounces of gold.
The 2024 sustaining capex budget at Ҫӧpler of $29 million includes $9 million in capital leases for the Air Liquide oxygen plant.
Over the five-year period, the gold production profile at Çöpler is expected to increase to nearly 400,000 ounces annually by 2027, a 23% compound annual growth rate ("CAGR"), reflecting the significant gold recovery uplift enabled by the Grind-Leach Circuit that is expected to be completed by 2027 for total growth capital of $194 million. Over the five-year period, AISC are expected to be relatively flat in 2024 and 2025, before improving significantly in 2026 through 2028.
Marigold, USA
In 2023, gold production at Marigold was 278,488 ounces, a record for the operation over its more than 30-year operating history and in line with full-year guidance. Gold production was 82,794 ounces in the fourth quarter of 2023, at cost of sales of $1,095 per payable ounce and AISC of $1,170 per payable ounce.
In 2024, Marigold is expected to produce 155,000 to 175,000 ounces of gold at mine site cost of sales of $1,300 to $1,340 per payable ounce and AISC of $1,535 to $1,575 per payable ounce. For the full-year, production is expected to be 70% weighted to the second half of 2024, reflecting a second-half weighted grade profile and increased waste stripping in the first quarter. Marigold’s AISC profile is expected to trend well above its asset-level 2024 guidance ranges in the first half, reflecting the aforementioned production profile and waste stripping. The fourth quarter of 2024 is expected to represent Marigold’s strongest production and lowest cost period of the year.
Sustaining capital spend for Marigold in 2024 is forecasted to total $37 million, a more than 50% reduction in capital spend compared to 2023 levels which included the purchase of four new haul trucks to support waste stripping activities over the near-term. Waste stripping at Red Dot is a key focus for 2024 and 2025, enabling increased gold production over the remainder of the decade.
The gold production profile at Marigold is expected to increase to over 270,000 ounces annually in 2027, an 18% CAGR over that four-year period, and above 300,000 ounces by 2029. Costs are expected to improve significantly in 2026 as stacked grades increase due to increased ore contribution from Red Dot. Technical work is ongoing to potentially expand Marigold’s Mineral Reserves and enable mine life extensions beyond the current nine-year mine plan, including potential expansions to the Mackay, Valmy, New Millennium, and Buffalo Valley deposits.
Seabee, Canada
For 2023, gold production at Seabee was 90,777 ounces. Gold production was 38,757 ounces in the fourth quarter of 2023, at cost of sales of $666 per payable ounce and AISC of $916 per payable ounce. Processed grades in the fourth quarter averaged 10.1 g/t.
In 2024, Seabee is expected to produce 75,000 to 85,000 ounces of gold at mine site cost of sales of $990 to $1,030 per payable ounce and AISC of $1,495 to $1,535 per payable ounce. Seabee’s production is expected to be strongest in the first and third quarters of 2024, reflecting processed grades. Grades are expected to average between 5.0 and 6.0 g/t in 2024, slightly above the Seabee Mineral Reserve grade. Mine and mill productivity are expected to average approximately 1,300 tonnes per day through 2024. AISC are expected to be highest in the first half of the year, particularly the first quarter, reflecting purchases associated with the winter road season.
Sustaining capital expenditures are planned to total $40 million in 2024, including $24 million in capitalized underground development. Capital expenditures are expected to be concentrated in the first half of the year, particularly the first quarter, due to the winter road season.
Over the five-year period, Seabee’s production is expected to average approximately 75,000 ounces annually. Grades are expected to trend closer to 5.0 g/t in 2025 and beyond, while throughputs are expected to increase to 1,350 to 1,400 tonnes per day. Near-mine exploration continues with the goal of delineating new Mineral Reserves at Santoy 8, 9 and the Gap and Santoy Hangingwall targets. Exploration and resource development activity also continues to aggressively advance the Porky and Porky West targets as a potential new underground mining front that could complement and extend the existing Seabee mine life.
As a result of the updates to Mineral Reserves and Mineral Resources as of year-end 2023, the Company evaluated goodwill and long-lived assets for impairment. Based on that analysis, it is expected the Company will record a write-down of $50 million in goodwill at Seabee in the Company’s financial statements for the year ended December 31, 2023, to be released on February 21, 2024.
Puna, Argentina
For 2023, silver production from Puna was 9.7 million ounces, a record for the operation over its more than 15 year operating life and exceeding the mine’s original full-year production guidance range. Silver production was 2.8 million ounces in the fourth quarter of 2023 at cost of sales of $14.07 per payable ounce and AISC of $15.51 per payable ounce.
In 2024, Puna is expected to produce 8.75 to 9.50 million ounces of silver at mine site cost of sales of $16.50 to $18.00 per payable ounce and AISC of $14.75 to $16.25 per payable ounce. Production is expected to be 55% weighted to the second half of 2024, driven largely by grades that peak in the fourth quarter. Continued delivery of operational improvement initiatives has enabled further improvement to process plant throughputs at Puna, which are targeted to average more than 4,750 tonnes per day throughout the year. AISC are expected to be highest in the first half of 2024, including a peak in the first quarter, reflecting the site-level capital spend profile.
Sustaining capital expenditures are planned to total $17 million in 2024 and are primarily related to maintenance of mine and plant equipment.
Based on current Mineral Reserves, mining from the Chinchillas open pit is expected to be completed in 2026. Technical work continues to evaluate opportunities to extend the Puna life of mine through Mineral Reserve conversion at Chinchillas, as well as the definition of initial Mineral Reserves at the Cortaderas target.
Growth, Exploration and Resource Development
In 2024, growth exploration and resource development expenditures are expected to total $50 million. This growth exploration budget is a decrease of approximately 35% over 2023 budgets, reflecting the near-term focus on currently defined development projects. Growth capital expenditures are expected to total $117M, driven almost entirely by Çöpler and Hod Maden.
At Çöpler, 2024 consolidated exploration and resource development expenditures are estimated to total $12 million, with a primary focus on additional Mineral Reserve conversion and expansion of the Ҫӧpler and Çakmaktepe ore bodies. Regional exploration on the Kartaltepe licenses, most notably Mavidere / Mavidere South, is also continuing as the Company evaluates additional potential ore sources across the greater Çöpler district. Growth capital expenditures at Çöpler are expected to total $77 million and are associated with expansion costs for the Çöpler tailings storage facility, along with initial development costs for the installation of Grind-Leach Circuit to process oxide ore in 2027 and beyond.
At Marigold, 2024 consolidated exploration and resource development expenditures are estimated at $9 million, focusing on oxide Mineral Reserve additions and conversion at Buffalo Valley, Mackay, Valmy and New Millennium. Growth exploration expenditures also include geophysics and testing of new targets across the greater Marigold land package.
At Hod Maden, technical work continues ahead of a construction decision and accompanying project financing package. As per the previously disclosed transaction terms, during the earn-in period, SSR Mining will contribute 40% of project development costs. In 2024, the attributable spend at Hod Maden for SSR Mining is expected to total approximately $37 million. This includes continued advancement of initial earth works and site access activities, as well as the commencement of underground portal development in the second half of the year. In addition to SSR Mining’s attributable capital commitments, up to $30 million in earn-in structured payments are expected to be incurred in 2024. All Hod Maden development costs will be recorded at 100% attributable in SSR Mining’s financial statements, and then credited against accordingly by non-controlling interest inflows. Technical work completed to-date continues to affirm prior due diligence outcomes around project capital and scope, and an initial infill drill program continues at site with the aim of de-risking the first four years of the mine. Results to date have not shown any deviation from the existing resource model, affirming Hod Maden’s best-in-class grades.
At Seabee, 2024 consolidated exploration and resource development expenditures are estimated at $15 million with a focus on defining initial Mineral Reserves at the Porky and Porky West targets. Further drilling will also be completed at the Gap Hangingwall to evaluate potential extensions to the existing Mineral Reserves and mine life at Seabee. Earlier stage exploration activity also continues across the broader Seabee property, including follow-up sampling and potential drill testing at a number of regional targets.
At Puna, 2024 consolidated exploration and resource development expenditures are anticipated to total $10 million, with the majority of that spend allocated to advancing Mineral Resource definition at the Cortaderas target ahead of an initial economic evaluation of the target. Work is also underway to evaluate potential Mineral Reserve conversion at Chinchillas in order to extend the mine life in the near-term.
Other exploration and development expenditures total $4 million as SSR Mining advances greenfield opportunities across its portfolio, including drilling programs at the Copper Hill target in northeastern Türkiye and at the Amisk project in Saskatchewan. Mapping and sampling work is also continuing at earlier stage and regional opportunities in the U.S., Türkiye, and Canada.
(14) | The Company reports non-GAAP financial measures including free cash flow and All-In Sustaining Cost ("AISC") per ounce sold (a common measure in the mining industry), to manage and evaluate its operating performance at its mines. See "Cautionary Note Regarding Non-GAAP Financial Measures" for an explanation of these financial measures and a reconciliation of these financial measures to the most comparable GAAP financial measures. |
Technical Report Summaries ("TRS") Highlights
SSR Mining has published updated TRS for its four producing assets. The TRS for each asset are based exclusively on Mineral Reserves and expand upon the production profiles set out in the 2021 Technical Report Summaries. Effective dates for the 2023 reports are September 30, 2023 for Marigold, October 31, 2023 for Çöpler and December 31, 2023 for Seabee and Puna. Updated technical work at Hod Maden is ongoing.
Table 3: Key metrics from 2023 Technical Report Summaries
Producing Asset (15) | Mine Life | LOM Production | LOM Free Cash Flow | After-Tax NPV5% | ||||
Çöpler | 15 years | 4,254koz Au | $2,368M | $1,643M | ||||
Marigold | 9 years active mining / | 2,199koz Au | $1,072M | $800M | ||||
Seabee | 4 years | 327koz Au | $102M | $95M | ||||
Puna (16) | 3 years | 19.9 Moz Ag | $132M | $136M |
(15) | Figures are reported on a 100% basis. Çöpler is 80% owned by SSR Mining. | |
(16) | Puna 2023 TRS NPV uses an 8% discount rate. Puna NPV exceeds life of mine free cash flow as a result of discounting factor on reclamation spend following the completion of production. |
Ҫӧpler Technical Report Summary
The Technical Report Summary on the Ҫӧpler Property, Türkiye (the "2023 Ҫӧpler TRS") represents the synthesis of extensive exploration activity, updated geotechnical and metallurgical test work, and ongoing continual improvement initiatives. Overall, total Mineral Reserves have increased 2% from end-2022, despite 2023 depletion, reflecting successful Mineral Resource conversion at Çakmaktepe, which now hosts 3 million ounces of gold Mineral Reserves (2.4 million ounces attributable). The resulting consolidated 5.1 million ounces of Mineral Reserves (4.1 million ounces attributable) at Ҫӧpler support a 15-year mine life, with significant potential upside across near-mine and regional targets going forward.
Highlights of the 2023 Ҫӧpler TRS include:
NPV5% of $1.64 billion;
15-year mine life including
Life of mine production of 4,254 ounces gold, a ~10% increase in total production over the 2021 TRS Mineral Reserve Case;
Average annual production of 281,000 ounces of gold over the life of mine;
Average cost of sales of $965 per payable ounce and AISC of $1,003 per payable ounce over the life of mine;
Average annual after-tax operating cash flow of $197 million and free cash flow of approximately $160 million over the life of mine;
An initial $194 million investment in a Grind-Leach Circuit, expected to be completed in early 2027, adds an incremental 570 thousand ounces of life of mine gold production from Çakmaktepe.
Grind Leach projected IRR: +30%
Table 4: Key Metrics From 2023 Ҫӧpler TRS
| Unit | 2024 – 2028 | Life of Mine (18) | |||
Total Production | Au koz | 1,494 | 4,254 | |||
Avg. Annual Production | Au koz | 299 | 281 | |||
|
|
|
| |||
Total Operating Cash Flow | $M | $1,059 | $3,005 | |||
Total Capital Costs | $M | $394 | $637 | |||
Total Free Cash Flow | $M | $665 | $2,368 | |||
Average Annual Free Cash Flow | $M | $133 | $160 | |||
|
|
|
| |||
Cost of Sales | Au $/oz | $1,081 | $965 | |||
Cash Costs | Au $/oz | $1,081 | $965 | |||
AISC | Au $/oz | $1,104 | $1,003 |
(17) | Total capital costs include reclamation and working capital. | |
(18) | Life of mine average production and free cash flow reflect the period from 2024 to 2038. |
Additional potential for upside at Ҫӧpler
The updated 2023 Çöpler TRS highlights improvement to the production and free cash flow profile as compared to the Reserve Case production scenario in the 2021 Çöpler TRS. Additionally there are multiple opportunities for possible growth beyond the 2023 TRS that are currently being investigated, including:
Continued evaluation of additional Çakmaktepe Mineral Reserve growth at depth and through additional targets along trend to the southeast;
Near-pit exploration success at targets adjacent to the Ҫӧpler Pits that could further complement the existing Sulfide and/or Oxide production profile;
Initial drill testing of higher-grade, discreet mineralization targets below the Çöpler, Manganese and Marble pits that could potentially support future growth
Optimization of the blended ore feed to the three flowsheets (sulfide plant, grind-leach circuit and heap leach pads) to increase recoveries and value;
Evaluation of additional tailings capacity, including dry stack tailings, to support additional Mineral Reserve conversion and mine life extension; and
Regional exploration success at targets across the Ҫӧpler District, in particular Mavidere and Mavidere South.
SSR Mining has budgeted more than 30,000 meters of exploration and resource development drilling across the Ҫӧpler District in 2024.
As a result of the removal of Mineral Resources associated with C2 at Çöpler, SSR Mining performed its long lived asset and impairment evaluation. Based on the evaluation, the Company expects to record a $349 million non-cash write down, adjusting its fixed asset and mineral property value from approximately $2.80 billion to $2.45 billion in its full-year 2023 results to be released on February 21, 2024.
Marigold Technical Report Summary
The 2023 Technical Report Summary on the Marigold Complex, Nevada, USA (the "2023 Marigold TRS") is based exclusively on existing Mineral Reserves and does not yet incorporate initial Mineral Resources at Buffalo Valley, or any potential Mineral Resource conversion at the Valmy, Mackay or New Millennium targets. The focus of continued near-mine exploration will be to deliver additional Mineral Reserves at brownfield targets to extend the 9-year Marigold mine life. The mine plan in the TRS expands on the production profile outlined in Marigold’s 2021 Technical Report Summary, including a 4% increase in remaining life of mine production as compared to the remaining production profile in the 2021 Technical Report Summary. Cost assumptions were also updated to reflect recent actual results. For the remainder of the current mine plan, there are limited major capital projects expected, positioning the mine to deliver strong free cash flow.
Highlights of the 2023 Marigold TRS include:
NPV5% of $800 million;
9-year mine life, 15 years of total production including residual leaching;
Life of mine production of 2.2 million ounces gold, a 4% increase in LOM production over the remaining period in the prior 2021 technical report;
Average annual production of 212,000 ounces of gold over the life of mine period from 2024 to 2032;
Average cost of sales of $1,065 per ounce and AISC of $1,213 per ounce over the life of mine; and
Average annual after-tax operating cash flow of $124 million and free cash flow of $95 million over the nine-year period of active mining.
Table 5. Key Metrics from the Marigold TRS
|
| 2024 – 2028 | Life of Mine (20) | |||
Total Production | Au koz | 1,068 | 2,199 | |||
Average Annual Production | Au koz | 214 | 212 | |||
|
|
|
| |||
Operating Cash Flow | $M | $549 | $1,399 | |||
Total Capital Costs (19) | $M | $204 | $327 | |||
Total Free Cash Flow | $M | $345 | $1,072 | |||
Average Annual Free Cash Flow | $M | $69 | $95 | |||
|
|
|
| |||
Cost of Sales | $ / Au oz | $1,239 | $1,065 | |||
Cash Costs | $ / Au oz | $1,239 | $1,065 | |||
AISC | $ / Au oz | $1,430 | $1,213 |
(19) | Total capital costs include working capital and reclamation. | |
(20) | Life of mine metrics are from 2024 onwards. Average annual metrics exclude residual leaching. |
Additional potential for upside at Marigold
The Marigold property hosts significant potential for mine life extension through future Mineral Reserve conversion and growth. Opportunities for possible growth beyond the TRS life of mine plan include:
M&I Mineral Resources of 1.7 million ounces gold and Inferred Resources of 0.4 million ounces gold not incorporated in the current Mineral Reserve,
Continued exploration across the Marigold land package with a focus on definition and growth opportunities,
New Millennium and Buffalo Valley may host potential for longer-term stand-alone processing infrastructure, improving operating costs through shorter hauls
SSR Mining has planned nearly 50,000 meters of exploration and resource development drilling at Marigold in 2024 to continue advancing these brownfield exploration targets.
Mineral Reserves and Mineral Resources ("MRMR") for Year-End 2023
SSR Mining reported its updated MRMR as of December 31, 2023, reflecting depletion that occurred through mining activity, stockpile changes, new Mineral Reserves and Mineral Resources delineated from drilling activity, Mineral Resource conversion, and changes resulting from asset acquisitions and divestitures announced in 2023. SSR Mining continues to advance exploration and resource development activities at each of its assets, and this data will be incorporated into MRMR statements as the accompanying technical work so dictates.
As per Subpart 1300 of Regulation S-K, the Company’s year-end 2023 MRMR are presented on an attributable basis.
Commodity price assumptions aligned with peers: The gold price used in the calculation of Mineral Reserves was increased from $1,350 per ounce in 2022 to $1,450 per ounce used in 2023. The gold price used in Seabee’s Mineral Reserve price remained unchanged at $1,600 per ounce, All other commodity prices used in the calculation of Mineral Reserves for both 2023 and 2022 are unchanged from $18.50 per ounce silver, $0.90 per pound of lead, $1.05 per pound of zinc, and $3.30 per pound copper. Mineral Resource prices of $1,750 per ounce gold, $22.00 per ounce silver, $0.95 per pound lead, $1.15 per pound zinc and $3.95 per pound copper were unchanged from 2022.
Acquisition of Hod Maden; Non-Core San Luis Project Divested: In the second quarter of 2023, SSR Mining announced the acquisition of an up to 40% ownership interest and operatorship in the Hod Maden gold-copper project. At a 40% basis, Hod Maden will contribute nearly one million ounces of gold and approximately 115 million pounds of copper to SSR Mining’s Mineral Reserves. As announced on November 30, 2023, SSR Mining entered into an agreement to sell its San Luis project. As a result, all Measured, Indicated and Inferred Mineral Resources at San Luis were removed from SSR Mining’s consolidated Mineral Resource statement. No Mineral Reserves had been identified at San Luis.
Mineral Reserves: Gold Mineral Reserves as of December 31, 2023 were 7.3 million, excluding any contribution from Hod Maden, down 5% compared to year-end 2022, and reflecting mine depletion and Mineral Resource conversion. Total gold equivalent Mineral Reserves as of December 31, 2023 were 7.8 million ounces.
Measured and Indicated Mineral Resources: Gold Measured and Indicated Mineral Resources as of December 31, 2023 were 4.0 million ounces, excluding any contribution from Hod Maden, down 30% or 1.7 million ounces as compared to year-end 2022. Total gold equivalent Measured and Indicated Mineral Resources were 5.3 million ounces, down 28% or 2.0 million ounces from the prior year largely a result of Mineral Resource conversion, the sale of San Luis, and the removal of copper-gold mineralization associated with the C2 Project at Çöpler from the Company’s Mineral Resources.
Inferred Mineral Resources: Gold Inferred Mineral Resources of 2.6 million ounces, excluding any contribution from Hod Maden, decreased by 44% or 2.1 million ounces as compared to year-end 2022 Inferred Mineral Resources. Gold equivalent Inferred Mineral Resources of 3.2 million ounces decreased by 47% or 2.7 million ounces as compared to year-end 2022. This was largely driven by the sale of San Luis and the aforementioned removal of C2 mineralization from all categories of Mineral Resources.
Table 6: SSR Mining Mineral Reserves and Resources as of December 31, 2023 (21) | ||||||||||||||||
SSRM Attributable | Gold | y/y | Silver | y/y | Lead | Zinc | Copper | AuEq (22) | ||||||||
koz | % | koz | % | Mlb | Mlb | Mlb | koz | |||||||||
Total P+P Reserves | 7,275 | (5%) | 26,806 | (33%) | 113 | 20 | 27 | 7,764 | ||||||||
Total M&I Resource (23) | 4,034 | (30%) | 66,218 | (1%) | 196 | 404 | 30 | 5,307 | ||||||||
Total Inferred Resource | 2,642 | (43%) | 20,932 | (46%) | 24 | 227 | 24 | 3,211 | ||||||||
(21) | MRMR are shown as attributable to SSR Mining only. As of December 31, 2023, SSR Mining owns 80% of the Çöpler district. Hod Maden Mineral Reserves and Mineral Resources are not included in SSR Mining’s consolidated MRMR tables as of year-end 2023. |
(22) | All gold equivalent ounces (GEO or AuEq) figures are based on the above-mentioned commodity prices. Metal equivalence is calculated for the respective and applicable metals as follows: GEO = Au oz + ((Ag oz * Ag price) + (Pb lb * Pb price per pound) + (Zn lb * Zn price per pound) + (Cu lb * Cu price per pound)) / (Au price per ounce). |
(23) | Measured and indicated Mineral Resources are shown exclusive of Mineral Reserves. |
Hod Maden | Gold | Copper | AuEq (24) | |||
koz | Mlb | koz | ||||
Total P+P Reserves (40% Attributable) | 981 | 115 | 1,246 |
(24) | All gold equivalent ounces (GEO or AuEq) figures are based on a $1,300/oz gold price and $3.00/lb copper price. Metal equivalence is calculated for Hod Maden as follows: GEO = Au oz + (Cu lb * Cu price per pound) / (Au price per ounce). See endnote on Reserve and Resource Estimates by Mineral for Hod Maden for the assumptions on which these Mineral Reserves are reported. |
Conference Call Information
To accompany this press release, SSR Mining’s senior leadership team will host a conference call this morning to provide an overview of current operations as well as the Company’s outlook and long-term growth strategy. Investors, media and the public are invited to listen to the conference call and accompanying webcast.
Conference call and webcast: Tuesday, February 13, 2024, at 9:00 am EST.
Toll-free in U.S. and Canada: +1 (800) 319-4610
All other callers: +1 (604) 638-5340
Webcast: http://ir.ssrmining.com/investors/eventsThe conference call will be archived and available on our website. Audio replay will be available for two weeks by calling:
Toll-free in U.S. and Canada: +1 (855) 669-9658, replay code 0631
All other callers: +1 (412) 317-0088, replay code 0631
Assumptions
All figures are in U.S. dollars, unless otherwise noted. Gold equivalent figures for operating guidance are based on a gold-to-silver ratio of 81:1 in 2024, 79:1 in 2025 and 76:1 in 2026 and beyond. Gold equivalent figures for 2023 are based on a gold-silver ratio of 83:1. Cost of sales, cash costs, AISC and capital expenditure guidance is based on an exchange rate of 1.33 Canadian dollars to one U.S. dollar and an exchange rate of 34 Turkish Lira to one U.S. dollar and are subject to the key assumptions, risks and uncertainties described under "Cautionary Note Regarding Forward-Looking Information and Statements". All figures are presented on a 100% basis, unless otherwise noted. Çöpler is 80% owned by SSR Mining. Hod Maden is 10% owned by SSR Mining but is classified as a variable interest entity due to SSR Mining’s majority voting rights within the entity. SSR Mining has the option to increase its ownership to 40% through contingent payments during the construction period.
Consensus gold and silver prices were used in the compilation of the 2023 TRS. This includes gold prices of: 2023 - $1,925/oz; 2024 - $1,930/oz; 2025 - $1,890/oz; 2026 - $1,810/oz; 2027 - $1,780/oz; long-term - $1,755/oz, and silver prices of: 2023 - $23.50/oz; 2024 - $24.00/oz; 2025 – $23.95/oz; 2026 – $23.70/oz; 2027 - $23.35/oz; long-term - $22.75/oz.
About SSR Mining
SSR Mining Inc. is a leading, free cash flow focused gold company with four producing operations located in the USA, Türkiye, Canada, and Argentina, combined with a global pipeline of high-quality development and exploration assets. Over the last three years, the four operating assets combined have produced on average more than 700,000 gold-equivalent ounces annually. SSR Mining is listed under the ticker symbol SSRM on the Nasdaq and the TSX, and SSR on the ASX.
Reserve and Resource Estimates by Mineral for Hod Maden
The Mineral Reserves and Mineral Resources for Hod Maden as of December 31, 2023 that are presented herein are estimates that have been prepared by SSR Mining based on data available as of July 2019 and have been approved by internal SSR Mining qualified persons, as defined under Regulation S-K 1300. Hod Maden is not considered a material property of the Company, as it relates to Regulation S-K 1300.
The Hod Maden Resources and Hod Maden Reserves (as defined below) are estimates made by SSR Mining and have not been prepared, reviewed or verified by an independent, third-party qualified person and have not been prepared or presented in accordance with Regulations S-K 1300.
The Hod Maden Reserves are estimates based on information available at the time of calculation in a manner consistent with industry practice.
Measured and Indicated Resources were converted to Proven and Probable Mineral Reserves through application of relevant modifying factors and the appropriate mining recovery and dilution parameters were applied. Mineral Reserves are reported based on mined ore to be delivered to the plant as mill feed. Ounces of gold or pounds of copper in the Hod Maden Reserves presented herein are calculated without regard to any losses during metallurgical treatment. Market price fluctuations of gold and copper, as well as increased cost of production/sales or reduced metallurgical recovery rates, could result in the Hod Maden Reserves containing relatively lower grades of mineralization uneconomic to exploit and result in a decrease in actual recovery as compared to the Hod Maden Reserves reported herein.
The Mineral Resources presented herein for Hod Maden (the "Hod Maden Resources") are presented exclusive of the Hod Maden Reserves. Due to the uncertainty that may be attached to Inferred Mineral Resources, it cannot be assumed that all or any part of an Inferred Mineral Resource will be upgraded to an Indicated or Measured Mineral Resource as a result of continued exploration.
Hod Maden Reserves and Hod Maden Resources are based on $1,300/oz gold price and $3.00/lb copper and an 85% metallurgical recovery for gold, and are reported based on incremental cut-off of NSR of $63/t and $40/t for development. Metals shown in the tables are contained metals in ore mined and processed. Tonnage is metric tonnes, ounces represent troy ounces, and g/t represents grams per metric tonne. The point of reference for the Hod Maden Reserves is the proposed onsite processing facility.
Cautionary Note Regarding Forward-Looking Information and Statements:
Except for statements of historical fact relating to us, certain statements contained in this news release constitute forward-looking information, future oriented financial information, or financial outlooks (collectively "forward-looking information") within the meaning of applicable securities laws. Forward-looking information may be contained in this document and our other public filings. Forward-looking information relates to statements concerning our outlook and anticipated events or results and in some cases, can be identified by terminology such as "may", "will", "could", "should", "expect", "plan", "anticipate", "believe", "intend", "estimate", "projects", "predict", "potential", "continue" or other similar expressions concerning matters that are not historical facts.
Forward-looking information and statements in this news release are based on certain key expectations and assumptions made by us. Although we believe that the expectations and assumptions on which such forward-looking information and statements are based are reasonable, undue reliance should not be placed on the forward-looking information and statements because we can give no assurance that they will prove to be correct. Forward-looking information and statements are subject to various risks and uncertainties which could cause actual results and experience to differ materially from the anticipated results or expectations expressed in this news release. The key risks and uncertainties include, but are not limited to: local and global political and economic conditions; governmental and regulatory requirements and actions by governmental authorities, including changes in government policy, government ownership requirements, changes in environmental, tax and other laws or regulations and the interpretation thereof; developments with respect to global pandemics, including the duration, severity and scope of a pandemic and potential impacts on mining operations; and other risk factors detailed from time to time in our reports filed with the Securities and Exchange Commission on EDGAR and the Canadian securities regulatory authorities on SEDAR.
Forward-looking information and statements in this news release include any statements concerning, among other things: forecasts and outlook; preliminary cost reporting in this document; timing, production, operating, cost, and capital expenditure guidance; our operational and development targets and catalysts and the impact of any suspensions on operations; the results of any gold reconciliations; the ability to discover additional oxide gold ore; the generation of free cash flow and payment of dividends; matters relating to proposed exploration; communications with local stakeholders; maintaining community and government relations; negotiations of joint ventures; negotiation and completion of transactions; commodity prices; Mineral Resources, Mineral Reserves, conversion of Mineral Resources, realization of Mineral Reserves, and the existence or realization of Mineral Resource estimates; the development approach; the timing and amount of future production; the timing of studies, announcements, and analysis; the timing of construction and development of proposed mines and process facilities; capital and operating expenditures; economic conditions; availability of sufficient financing; exploration plans; receipt of regulatory approvals; timing and impact surrounding suspension or interruption of operations as a result of regulatory requirements or actions by governmental authority; renewal of NCIB program; and any and all other timing, exploration, development, operational, financial, budgetary, economic, legal, social, environmental, regulatory, and political matters that may influence or be influenced by future events or conditions.
Such forward-looking information and statements are based on a number of material factors and assumptions, including, but not limited in any manner to, those disclosed in any other of our filings on EDGAR and SEDAR, and include: the inherent speculative nature of exploration results; the ability to explore; communications with local stakeholders; maintaining community and governmental relations; status of negotiations of joint ventures; weather conditions at our operations; commodity prices; the ultimate determination of and realization of Mineral Reserves; existence or realization of Mineral Resources; the development approach; availability and receipt of required approvals, titles, licenses and permits; sufficient working capital to develop and operate the mines and implement development plans; access to adequate services and supplies; foreign currency exchange rates; interest rates; access to capital markets and associated cost of funds; availability of a qualified work force; ability to negotiate, finalize, and execute relevant agreements; lack of social opposition to our mines or facilities; lack of legal challenges with respect to our properties; the timing and amount of future production; the ability to meet production, cost, and capital expenditure targets; timing and ability to produce studies and analyses; capital and operating expenditures; economic conditions; availability of sufficient financing; the ultimate ability to mine, process, and sell mineral products on economically favorable terms; and any and all other timing, exploration, development, operational, financial, budgetary, economic, legal, social, geopolitical, regulatory and political factors that may influence future events or conditions. While we consider these factors and assumptions to be reasonable based on information currently available to us, they may prove to be incorrect.
The above list is not exhaustive of the factors that may affect any of the Company’s forward-looking information. You should not place undue reliance on forward-looking information and statements. Forward-looking information and statements are only predictions based on our current expectations and our projections about future events. Actual results may vary from such forward-looking information for a variety of reasons including, but not limited to, risks and uncertainties disclosed in our filings on our website at www.ssrmining.com, on SEDAR at www.sedarplus.ca, on EDGAR at www.sec.gov and on the ASX at www.asx.com.au and other unforeseen events or circumstances. Other than as required by law, we do not intend, and undertake no obligation to update any forward-looking information to reflect, among other things, new information or future events. The information contained on, or that may be accessed through, our website is not incorporated by reference into, and is not a part of, this document.
Cautionary Note to U.S. Investors
This news release includes terms that comply with reporting standards in Canada under National Instrument 43-101 – Standards of Disclosure for Mineral Projects ("NI 43-101"), including the terms "Mineral Reserves" and "Mineral Resources". NI 43-101 is a rule developed by the Canadian Securities Administrators that establishes standards for all public disclosure an issuer makes of scientific and technical information concerning mineral projects. The standards of NI 43-101 differ significantly from the requirements of the SEC. Accordingly, information concerning mineral deposits set forth herein may not be comparable with information made in accordance with U.S. standards.
Qualified Persons
All key assumptions, parameters and methods used to estimate Mineral Reserves and Mineral Resources reported herein in respect of Çöpler, Marigold, Seabee and Puna, and the data verification procedures followed, are set out in the Technical Report Summary on the Çöpler Property, Türkiye, the Technical Report Summary on the Marigold Complex, Nevada, USA , the Technical Report Summary on the Seabee Gold Operation, Saskatchewan, Canada, and the Technical Report Summary on the Puna Operations, Argentina (each a "Technical Report Summary"). Each Technical Report Summary has been filed with the SEC as part of the Company's Current Report on Form 8-K filed on February 13, 2024, and incorporated by reference herein, and is available for review on EDGAR at www.sec.gov. Each Technical Report Summary will also be filed with the applicable securities regulatory authorities in Canada as a technical report in compliance with National Instrument 43-101 – Standards of Disclosure for Mineral Projects, and will be available for review on SEDAR+ at www.sedarplus.ca.
Except as otherwise set out herein, the scientific and technical information contained in this press release relating to Çöpler has been reviewed and verified by SLR International Corporation, RSC Consulting Ltd., WSP USA Inc., and Ausenco Services Pty Limited, each of which is a qualified person under Subpart 1300 of Regulation SK with respect to the sections of the 2023 Çöpler TRS for which such entity acted as qualified person, as set forth in the 2023 Çöpler TRS. The scientific and technical information contained in this press release relating to Marigold, Seabee and Puna TRS has been reviewed and verified by SLR International Corporation, a qualified person under Subpart 1300 of Regulation SK.
Cautionary Note Regarding Non-GAAP Measures
We have included certain non-GAAP performance measures throughout this document. These performance measures are employed by us to measure our operating and economic performance internally and to assist in decision-making, as well as to provide key performance information to senior management. We believe that, in addition to conventional measures prepared in accordance with GAAP, certain investors and other stakeholders also use this information to evaluate our operating and financial performance; however, these non-GAAP performance measures do not have any standardized meaning. Accordingly, these performance measures are intended to provide additional information and should not be considered in isolation or as a substitute for measures of performance prepared in accordance with GAAP. Our definitions of our non-GAAP financial measures may not be comparable to similarly titled measures reported by other companies. These non-GAAP measures should be read in conjunction with our condensed consolidated interim financial statements.
Cash costs, AISC per ounce sold, and free cash flow are Non-GAAP Measures with no standardized definition under U.S GAAP.
The Company uses cash costs per ounce of precious metals sold, a non-GAAP financial measure, to monitor its operating performance internally, including operating cash costs, and for internal decision making. The Company believes this measure provides investors and analysts with useful information about its underlying cash costs of operations and the impact of by-product credits on its cost structure. The Company also believes it is a relevant metric used to understand its operating profitability and ability to generate cash flow. When deriving the cost of sales associated with an ounce of precious metal, the Company includes the by-product credits as it considers the cost to produce the gold or silver is reduced as a result of the by-product sales incidental to the gold and silver production process, thereby allowing management and other stakeholders to assess the net costs of gold and silver production. In calculating cash costs per payable ounce, the Company also excludes the impact of specific items that are significant, but not reflective of its underlying operations. When deriving the number of ounces of precious metal sold, the Company considers the physical ounces available for sale after the treatment and refining process, commonly referred to as payable metal, as this is what is sold to third parties. Cash costs per payable ounce metrics, net of by-product credits, are also used in the Company's internal decision making processes.
AISC includes total cost of sales incurred at the Company's mining operations, which forms the basis of its by-product cash costs. Additionally, the Company includes sustaining capital expenditures, sustaining mine-site exploration and evaluation costs, reclamation cost accretion and amortization and general and administrative expenses. This measure seeks to reflect the ongoing cost of gold and silver production from current operations; therefore, growth expenditures are excluded. Certain other cash expenditures, including tax payments and financing costs are also excluded. The Company believes that this measure represents the total costs of producing gold and silver from current operations and provides the Company and other stakeholders with additional information about its operating performance and ability to generate cash flows. It allows the Company to assess its ability to support capital expenditures and to sustain future production from the generation of operating cash flows.
We have presented our projected 2027 AISC trend in this press release. We have not presented a projected 2027 cost of sales amount, the most comparable GAAP measure, and a corresponding reconciliation of projected 2027 cost of sales to projected 2027 AISC in this press release because the adjustments, including inventory movements and related expenses, for example, are not calculable at this time without unreasonable efforts. In addition, we believe projections of these adjustments would imply a degree of precision and certainty that could be confusing to investors. It is probable that projected 2027 AISC may be materially different from projected 2027 cost of sales, the most comparable GAAP financial measure. We have, however, presented a reconciliation of our full year 2024 cost of sales guidance to our full year AISC guidance below.
The following tables provide a reconciliation of cost of sales to cash costs and AISC:
|
| Three Months Ended December 31, 2023 | |||||||||||||||||||||
(in thousands, unless otherwise noted) |
| Çöpler |
| Marigold |
| Seabee |
| Puna |
| Corporate |
| Total | |||||||||||
Cost of sales (GAAP) (25) |
| $ | 69,259 |
|
| $ | 88,920 |
|
| $ | 21,338 |
|
| $ | 39,822 |
|
| $ | — |
| $ | 219,340 |
|
By-product credits |
| $ | (849 | ) |
| $ | (55 | ) |
| $ | (13 | ) |
| $ | (15,310 | ) |
| $ | — |
| $ | (16,227 | ) |
Treatment and refining charges |
| $ | — |
|
| $ | 157 |
|
| $ | 28 |
|
| $ | 4,685 |
|
| $ | — |
| $ | 4,869 |
|
Cash costs (non-GAAP) |
| $ | 68,410 |
|
| $ | 89,023 |
|
| $ | 21,353 |
|
| $ | 29,197 |
|
| $ | — |
| $ | 207,982 |
|
Sustaining capital expenditures |
| $ | 17,979 |
|
| $ | 4,453 |
|
| $ | 6,774 |
|
| $ | 3,293 |
|
| $ | — |
| $ | 32,499 |
|
Sustaining exploration and evaluation expense |
| $ | 3,419 |
|
| $ | 872 |
|
| $ | — |
|
| $ | — |
|
| $ | — |
| $ | 4,291 |
|
Reclamation cost accretion and amortization (26) |
| $ | 427 |
|
| $ | 609 |
|
| $ | 1,239 |
|
| $ | 11,302 |
|
| $ | — |
| $ | 13,578 |
|
General and administrative expense and stock- |
| $ | 1,384 |
|
| $ | — |
|
| $ | — |
|
| $ | 114 |
|
| $ | 13,582 |
| $ | 15,080 |
|
Total AISC (non-GAAP) |
| $ | 91,619 |
|
| $ | 94,957 |
|
| $ | 29,365 |
|
| $ | 43,906 |
|
| $ | 13,582 |
| $ | 273,429 |
|
|
|
|
|
|
|
|
|
|
|
|
|
| |||||||||||
Gold sold (oz) |
|
| 59,694 |
|
|
| 81,173 |
|
|
| 32,050 |
|
|
| — |
|
|
| — |
|
| 172,917 |
|
Silver sold (oz) |
|
| — |
|
|
| — |
|
|
| — |
|
|
| 2,830,057 |
|
|
| — |
|
| 2,830,057 |
|
Gold equivalent sold (oz) (27, 28) |
|
| 59,694 |
|
|
| 81,173 |
|
|
| 32,050 |
|
|
| 33,277 |
|
|
| — |
|
| 206,194 |
|
|
|
|
|
|
|
|
|
|
|
|
|
| |||||||||||
Cost of sales per gold ounces sold |
| $ | 1,160 |
|
| $ | 1,095 |
|
| $ | 666 |
|
|
| N/A |
|
|
| N/A |
|
| N/A |
|
Cost of sales per silver ounces sold |
|
| N/A |
|
|
| N/A |
|
|
| N/A |
|
| $ | 14.07 |
|
|
| N/A |
|
| N/A |
|
Cost of sales per gold equivalent ounce sold |
| $ | 1,160 |
|
| $ | 1,095 |
|
| $ | 666 |
|
| $ | 1,197 |
|
|
| N/A |
| $ | 1,064 |
|
Cash cost per gold ounce sold |
| $ | 1,146 |
|
| $ | 1,097 |
|
| $ | 666 |
|
|
| N/A |
|
|
| N/A |
|
| N/A |
|
Cash cost per silver ounce sold |
|
| N/A |
|
|
| N/A |
|
|
| N/A |
|
| $ | 10.32 |
|
|
| N/A |
|
| N/A |
|
Cash cost per gold equivalent ounce sold |
| $ | 1,146 |
|
| $ | 1,097 |
|
| $ | 666 |
|
| $ | 877 |
|
|
| N/A |
| $ | 1,008 |
|
AISC per gold ounce sold |
| $ | 1,535 |
|
| $ | 1,170 |
|
| $ | 916 |
|
|
| N/A |
|
|
| N/A |
|
| N/A |
|
AISC per silver ounce sold |
|
| N/A |
|
|
| N/A |
|
|
| N/A |
|
| $ | 15.51 |
|
|
| N/A |
|
| N/A |
|
AISC per gold equivalent ounce sold |
| $ | 1,535 |
|
| $ | 1,170 |
|
| $ | 916 |
|
| $ | 1,319 |
|
|
| N/A |
| $ | 1,326 |
|
| |||||||||||||||||||||||
|
| Twelve Months Ended December 31, 2023 | |||||||||||||||||||||
(in thousands, unless otherwise noted) |
| Çöpler |
| Marigold |
| Seabee |
| Puna |
| Corporate |
| Total | |||||||||||
Cost of sales (GAAP) (25) |
| $ | 268,628 |
|
| $ | 289,063 |
|
| $ | 82,898 |
|
| $ | 163,558 |
|
| $ | — |
| $ | 804,147 |
|
By-product credits |
| $ | (3,523 | ) |
| $ | (154 | ) |
| $ | (54 | ) |
| $ | (56,773 | ) |
| $ | — |
| $ | (60,504 | ) |
Treatment and refining charges |
| $ | — |
|
| $ | 666 |
|
| $ | 101 |
|
| $ | 18,649 |
|
| $ | — |
| $ | 19,416 |
|
Cash costs (non-GAAP) |
| $ | 265,105 |
|
| $ | 289,575 |
|
| $ | 82,945 |
|
| $ | 125,434 |
|
| $ | — |
| $ | 763,059 |
|
Sustaining capital expenditures |
| $ | 50,982 |
|
| $ | 79,151 |
|
| $ | 32,994 |
|
| $ | 13,193 |
|
| $ | — |
| $ | 176,320 |
|
Sustaining exploration and evaluation expense |
| $ | — |
|
| $ | 983 |
|
| $ | — |
|
| $ | — |
|
| $ | — |
| $ | 983 |
|
Reclamation cost accretion and amortization |
| $ | 1,709 |
|
| $ | 2,628 |
|
| $ | 3,347 |
|
| $ | 13,598 |
|
| $ | — |
| $ | 21,282 |
|
General and administrative expense and stock- |
| $ | 5,479 |
|
| $ | — |
|
| $ | — |
|
| $ | 246 |
|
| $ | 61,721 |
| $ | 67,446 |
|
Total AISC (non-GAAP) |
| $ | 323,275 |
|
| $ | 372,337 |
|
| $ | 119,286 |
|
| $ | 152,471 |
|
| $ | 61,721 |
| $ | 1,029,090 |
|
|
|
|
|
|
|
|
|
|
|
|
|
| |||||||||||
Gold sold (oz) |
|
| 225,599 |
|
|
| 275,962 |
|
|
| 83,610 |
|
|
| — |
|
|
| — |
|
| 585,171 |
|
Silver sold (oz) |
|
| — |
|
|
| — |
|
|
| — |
|
|
| 9,920,262 |
|
|
| — |
|
| 9,920,262 |
|
Gold equivalent sold (oz) (27, 28) |
|
| 225,599 |
|
|
| 275,962 |
|
|
| 83,610 |
|
|
| 119,423 |
|
|
| — |
|
| 704,594 |
|
|
|
|
|
|
|
|
|
|
|
|
|
| |||||||||||
Cost of sales per gold ounces sold |
| $ | 1,191 |
|
| $ | 1,047 |
|
| $ | 991 |
|
|
| N/A |
|
|
| N/A |
|
| N/A |
|
Cost of sales per silver ounces sold |
|
| N/A |
|
|
| N/A |
|
|
| N/A |
|
| $ | 16.49 |
|
|
| N/A |
|
| N/A |
|
Cost of sales per gold equivalent ounce sold |
| $ | 1,191 |
|
| $ | 1,047 |
|
| $ | 991 |
|
| $ | 1,370 |
|
|
| N/A |
| $ | 1,141 |
|
Cash cost per gold ounce sold |
| $ | 1,175 |
|
| $ | 1,049 |
|
| $ | 992 |
|
|
| N/A |
|
|
| N/A |
|
| N/A |
|
Cash cost per silver ounce sold |
|
| N/A |
|
|
| N/A |
|
|
| N/A |
|
| $ | 12.64 |
|
|
| N/A |
|
| N/A |
|
Cash cost per gold equivalent ounce sold |
| $ | 1,175 |
|
| $ | 1,049 |
|
| $ | 992 |
|
| $ | 1,050 |
|
|
| N/A |
| $ | 1,083 |
|
AISC per gold ounce sold |
| $ | 1,433 |
|
| $ | 1,349 |
|
| $ | 1,427 |
|
|
| N/A |
|
|
| N/A |
|
| N/A |
|
AISC per silver ounce sold |
|
| N/A |
|
|
| N/A |
|
|
| N/A |
|
| $ | 15.37 |
|
|
| N/A |
|
| N/A |
|
AISC per gold equivalent ounce sold |
| $ | 1,433 |
|
| $ | 1,349 |
|
| $ | 1,427 |
|
| $ | 1,277 |
|
|
| N/A |
| $ | 1,461 |
|
(25) | Excludes depreciation, depletion, and amortization. | ||
(26) | During the fourth quarter of 2023, the Company identified an adjustment of $10.5 million related to 2023 asset retirement cost depreciation, which was erroneously excluded from Puna's AISC calculation. The Company recognized the total adjustment in the fourth quarter of 2023 and the impact to prior periods was not material. The adjustment only impacts the AISC calculation and does not impact Exploration, evaluation and reclamation costs or Net income (loss) attributable to SSR Mining shareholders in the Company's Consolidated Statements of Operations. | ||
(27) | Gold equivalent ounces are calculated using the silver ounces produced or sold multiplied by the ratio of the silver price to the gold price, using the average LBMA prices for the period. The Company does not include copper, lead, or zinc as they are considered by-products. | ||
(28) | Gold equivalent ounces sold may not re-calculate based on amounts presented in this table due to rounding |
The following tables provide a reconciliation of cost of sales to cash costs and AISC used in the calculation of 2024 cost guidance:
(operating guidance 100% basis) (29) |
| Çöpler (30) |
| Marigold |
| Seabee |
| Puna |
| Hod |
| Corporate |
| Total | ||
Gold Production | koz |
| 200 - 220 |
| 155 - 175 |
| 75 - 85 |
| — |
| — |
| — |
| 430 - 480 | |
Silver Production | Moz |
| — |
| — |
| — |
| 8.75 - 9.50 |
| — |
| — |
| 8.75 - 9.50 | |
Gold Equivalent Production | koz |
| 200 - 220 |
| 155 - 175 |
| 75 - 85 |
| 110 - 120 |
| — |
| — |
| 540 - 600 | |
Gold Sold | koz |
| 200 - 220 |
| 155 - 175 |
| 75 - 85 |
| — |
| — |
| — |
| 435 - 485 | |
Silver Sold | Moz |
| — |
| — |
| — |
| 8.75 - 9.25 |
| — |
| — |
| 8.75 - 9.5 | |
Gold Equivalent Sold | koz |
| 200 - 220 |
| 155 - 175 |
| 75 - 85 |
| 110 - 120 |
| — |
| — |
| 540 - 600 | |
|
|
|
|
|
|
|
|
|
|
|
|
|
|
|
| |
Cost of Sales (GAAP) (32) | $M |
| 284 - 321 |
| 201 – 235 |
| 75 - 85 |
| 140 – 162 |
| — |
| — |
| 700 - 803 | |
By-Product Credits + Treatment & Refining Costs | $M |
| (2) |
| — |
| — |
| (45) |
| — |
| — |
| (46) | |
Cash Cost (non-GAAP) | $M |
| 282 – 319 |
| 202 – 235 |
| 75 – 85 |
| 96 – 117 |
| — |
| — |
| 654 - 756 | |
Sustaining Capital Expenditures (33) | $M |
| 29 |
| 37 |
| 40 |
| 17 |
| — |
| — |
| 123 | |
Reclamation Cost Accretion & Amortization | $M |
| 2 |
| 3 |
| 3 |
| 13 |
| — |
| — |
| 21 | |
General & Administrative | $M |
| — |
| — |
| — |
| — |
| — |
| 60 - 65 |
| 60 - 65 | |
All-In Sustaining Cost (non-GAAP) | $M |
| 313 - 350 |
| 241 – 274 |
| 118 – 128 |
| 125 – 147 |
| — |
| 60 – 65 |
| 857 - 965 | |
|
|
|
|
|
|
|
|
|
|
|
|
|
|
|
| |
Cost of Sales per Ounce (GAAP) (32) | $/oz |
| 1,420 - 1,460 |
| 1,300 - 1,340 |
| 990 - 1,030 |
| 16.50 - 18.00 |
| — |
| — |
| 1,300 - 1,350 | |
Cash Cost per Ounce (non-GAAP) (34) | $/oz |
| 1,410 - 1,450 |
| 1,300 - 1,340 |
| 990 - 1,030 |
| 11.50 - 13.00 |
| — |
| — |
| 1,220 - 1,270 | |
All-In Sustaining Cost per Ounce (non- | $/oz |
| 1,550 - 1,590 |
| 1,535 - 1,575 |
| 1,495 - 1,535 |
| 14.75 - 16.25 |
| — |
| — |
| 1,575 - 1,625 | |
|
|
|
|
|
|
|
|
|
|
|
|
|
|
|
| |
Growth Capital Expenditures | $M |
| 77 |
| 1 |
| 2 |
| — |
| 37 |
| — |
| 117 | |
Growth Exploration and Development Expenditures (35) | $M |
| 12 |
| 9 |
| 15 |
| 10 |
| — |
| 4 |
| 50 | |
Total Growth Capital | $M |
| 89 |
| 10 |
| 17 |
| 10 |
| 37 |
| 4 |
| 167 | |
(29) | Figures may not add due to rounding. Figures are reported on a 100% basis. | |
(30) | Çöpler is 80% owned by SSR Mining. | |
(31) | Hod Maden figures presented as 40% attributable. Hod Maden is currently 10% owned by SSR Mining. SSR Mining has the option to increase its ownership to 40% through funding of 40% of the pre-production capital commitments and up to $150 million in contingent payments. | |
(32) |
| Excludes depreciation, depletion, and amortization. |
(33) | Includes sustaining exploration and evaluation expenditures. Includes approximately $9 million in lease payments at Çöpler, $1 million in expensed sustaining exploration at Marigold and $24 million in underground mine development at Seabee. | |
(34) | SSR Mining reports the non-GAAP financial measures of cash costs and AISC per payable ounce of gold and silver sold to manage and evaluate operating performance at Çöpler, Marigold, Seabee and Puna. AISC includes reclamation cost accretion and amortization and certain lease payments. | |
(35) | Growth exploration and resource development expenditures are shown on a 100% basis, of which SSR Mining attributable amount totals $48 million. All growth exploration and resource development spend is expensed. Growth exploration includes project studies and evaluation. |
View source version on businesswire.com: https://www.businesswire.com/news/home/20240211540792/en/
Contacts
SSR Mining:
F. Edward Farid, Executive Vice President, Chief Corporate Development Officer
Alex Hunchak, Vice President, Investor Relations
SSR Mining Inc.
E-Mail: invest@ssrmining.com
Phone: +1 (888) 338-0046
To receive SSR Mining’s news releases by e-mail, please register using the SSR Mining website at www.ssrmining.com.
