Is Staar Surgical Co (STAA) Too Good to Be True? A Comprehensive Analysis of a Potential Value Trap
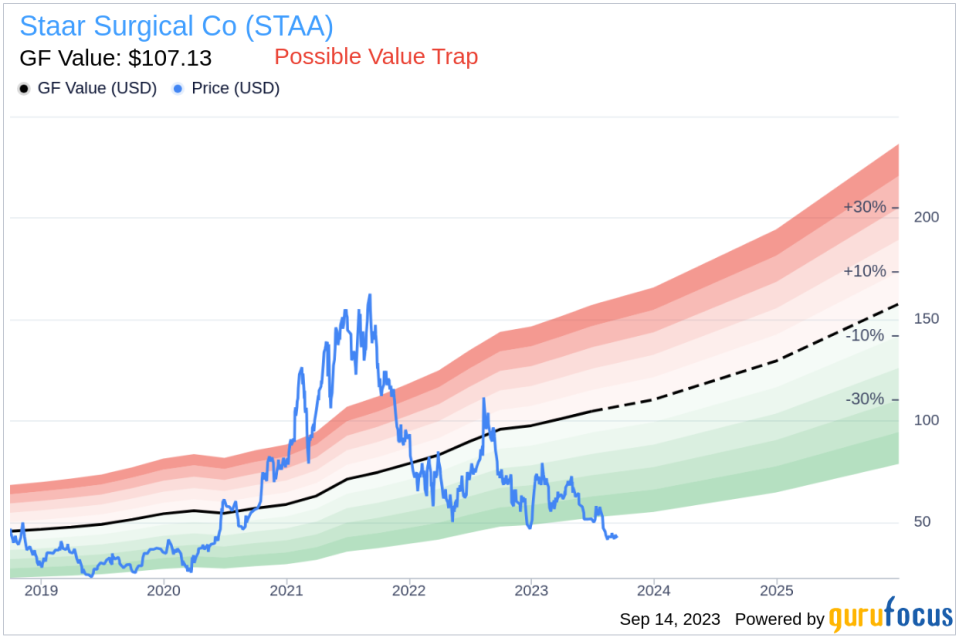
Value-focused investors are always on the hunt for stocks that are priced below their intrinsic value. One such stock that merits attention is Staar Surgical Co (NASDAQ:STAA). The stock, which is currently priced at 42.39, recorded a loss of 3.48% in a day and a 3-month decrease of 18.72%. The stock's fair valuation is $107.13, as indicated by its GF Value.
Understanding GF Value
The GF Value represents the current intrinsic value of a stock derived from our exclusive method. The GF Value Line on our summary page gives an overview of the fair value that the stock should be traded at. It is calculated based on three factors: historical multiples, GuruFocus adjustment factor, and future estimates of the business performance.
However, investors need to consider a more in-depth analysis before making an investment decision. Despite its seemingly attractive valuation, certain risk factors associated with Staar Surgical Co should not be ignored. These risks are primarily reflected through its low Beneish M-Score of -0.95 that exceeds -1.78, the threshold for potential earnings manipulation. These indicators suggest that Staar Surgical Co, despite its apparent undervaluation, might be a potential value trap. This complexity underlines the importance of thorough due diligence in investment decision-making.
Decoding the Beneish M-Score
Developed by Professor Messod Beneish, the Beneish M-Score is based on eight financial variables that reflect different aspects of a company's financial performance and position. These are Days Sales Outstanding (DSO), Gross Margin (GM), Total Long-term Assets Less Property, Plant and Equipment over Total Assets (TATA), change in Revenue (?REV), change in Depreciation and Amortization (?DA), change in Selling, General and Admin expenses (?SGA), change in Debt-to-Asset Ratio (?LVG), and Net Income Less Non-Operating Income and Cash Flow from Operations over Total Assets (?NOATA).
Staar Surgical Co: A Closer Look
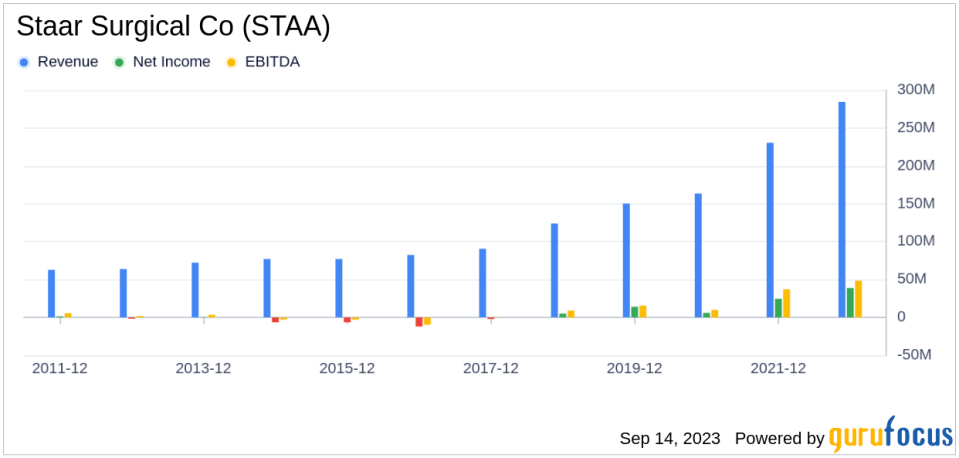
Staar Surgical Co is a manufacturer of lenses. It designs, develops, manufactures, and sells implantable lenses for the eye and delivery systems used to deliver the lenses into the eye. The company also make lenses which are used in surgery that treats cataracts. The company offers products are ICLs used in refractive surgery and IOLs used in cataract surgery. The company generated sales are from the ophthalmic surgical product segment.

Understanding Gross Margin and Asset Quality Ratio
The Gross Margin index tracks the evolution of a company's gross profit as a proportion of its revenue. A downward trend could indicate issues such as overproduction or more generous credit terms, both of which are potential red flags for earnings manipulation. By examining the past three years of Staar Surgical Co's historical data (2021: 76.39; 2022: 77.75; 2023: 77.97), we find that its Gross Margin has contracted by 5.78%. Such a contraction in the gross margin can negatively impact the company's profitability as it signifies lesser income from each dollar of sales. This could put a strain on the company's capacity to manage operating costs, potentially undermining its financial stability.
The asset quality ratio, calculated as Total Long-term Assets minus Property, Plant, and Equipment, divided by Total Assets, gauges the proportion of intangible or less tangible assets within a company's asset structure. Analyzing Staar Surgical Co's asset quality ratio over the past three years (2021: 0.02; 2022: 0.02; 2023: 0.06), an increase might signal underlying issues, such as capitalizing normal operating expenses or goodwill impairment. These factors can inflate assets and mask true operational costs, potentially misrepresenting the company's actual financial position, and raising concerns for investors about its true value and risk profile.
Decoding TATA Ratio
The TATA (Total Accruals to Total Assets) ratio, calculated as the Net Income less Non-Operating Income and Cash Flow from Operations, divided by Total Assets, is a key indicator of the quality of a company's earnings. For Staar Surgical Co, the current TATA ratio (TTM) stands at 0.022. A positive TATA ratio can be a warning sign, suggesting that the earnings are composed more of accruals rather than cash flow, which could be an indication of aggressive income recognition. Accrual accounting permits management some discretion in recognizing revenue and expenses, and a company intent on artificially boosting its earnings might exploit this flexibility.
Conclusion: Navigating the Value Trap
In conclusion, while Staar Surgical Co (NASDAQ:STAA) appears to be undervalued based on its GF Value, several risk factors suggest that it might be a potential value trap. The company's low Beneish M-score, contracting Gross Margin, increasing asset quality ratio, and positive TATA ratio all raise red flags that require careful consideration. Therefore, investors should conduct thorough due diligence before making an investment decision.
To find out the high quality companies that may deliver above average returns, please check out GuruFocus High Quality Low Capex Screener.
This article first appeared on GuruFocus.
