Stantec Inc.'s (TSE:STN) Stock Is Going Strong: Is the Market Following Fundamentals?
Stantec (TSE:STN) has had a great run on the share market with its stock up by a significant 27% over the last three months. Given that the market rewards strong financials in the long-term, we wonder if that is the case in this instance. Specifically, we decided to study Stantec's ROE in this article.
Return on Equity or ROE is a test of how effectively a company is growing its value and managing investors’ money. In other words, it is a profitability ratio which measures the rate of return on the capital provided by the company's shareholders.
View our latest analysis for Stantec
How To Calculate Return On Equity?
The formula for ROE is:
Return on Equity = Net Profit (from continuing operations) ÷ Shareholders' Equity
So, based on the above formula, the ROE for Stantec is:
13% = CA$330m ÷ CA$2.5b (Based on the trailing twelve months to September 2023).
The 'return' is the yearly profit. One way to conceptualize this is that for each CA$1 of shareholders' capital it has, the company made CA$0.13 in profit.
What Has ROE Got To Do With Earnings Growth?
Thus far, we have learned that ROE measures how efficiently a company is generating its profits. Based on how much of its profits the company chooses to reinvest or "retain", we are then able to evaluate a company's future ability to generate profits. Generally speaking, other things being equal, firms with a high return on equity and profit retention, have a higher growth rate than firms that don’t share these attributes.
A Side By Side comparison of Stantec's Earnings Growth And 13% ROE
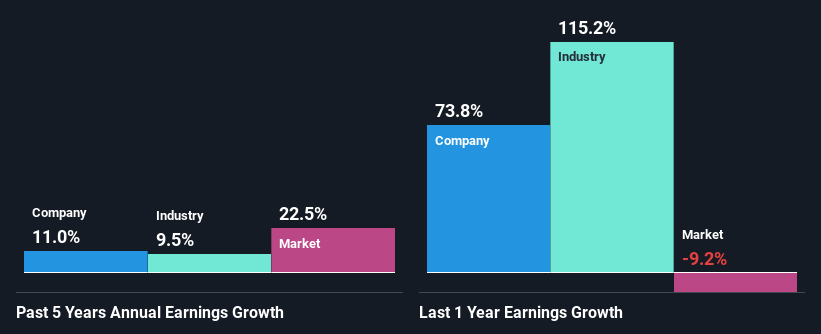
To begin with, Stantec seems to have a respectable ROE. Even when compared to the industry average of 15% the company's ROE looks quite decent. Consequently, this likely laid the ground for the decent growth of 11% seen over the past five years by Stantec.
We then performed a comparison between Stantec's net income growth with the industry, which revealed that the company's growth is similar to the average industry growth of 9.5% in the same 5-year period.
Earnings growth is a huge factor in stock valuation. What investors need to determine next is if the expected earnings growth, or the lack of it, is already built into the share price. Doing so will help them establish if the stock's future looks promising or ominous. What is STN worth today? The intrinsic value infographic in our free research report helps visualize whether STN is currently mispriced by the market.
Is Stantec Making Efficient Use Of Its Profits?
Stantec has a three-year median payout ratio of 37%, which implies that it retains the remaining 63% of its profits. This suggests that its dividend is well covered, and given the decent growth seen by the company, it looks like management is reinvesting its earnings efficiently.
Moreover, Stantec is determined to keep sharing its profits with shareholders which we infer from its long history of paying a dividend for at least ten years. Our latest analyst data shows that the future payout ratio of the company is expected to drop to 16% over the next three years. As a result, the expected drop in Stantec's payout ratio explains the anticipated rise in the company's future ROE to 18%, over the same period.
Summary
In total, we are pretty happy with Stantec's performance. Specifically, we like that the company is reinvesting a huge chunk of its profits at a high rate of return. This of course has caused the company to see substantial growth in its earnings. That being so, the latest analyst forecasts show that the company will continue to see an expansion in its earnings. Are these analysts expectations based on the broad expectations for the industry, or on the company's fundamentals? Click here to be taken to our analyst's forecasts page for the company.
Have feedback on this article? Concerned about the content? Get in touch with us directly. Alternatively, email editorial-team (at) simplywallst.com.
This article by Simply Wall St is general in nature. We provide commentary based on historical data and analyst forecasts only using an unbiased methodology and our articles are not intended to be financial advice. It does not constitute a recommendation to buy or sell any stock, and does not take account of your objectives, or your financial situation. We aim to bring you long-term focused analysis driven by fundamental data. Note that our analysis may not factor in the latest price-sensitive company announcements or qualitative material. Simply Wall St has no position in any stocks mentioned.
