State or government account for 42% of Telkom SA SOC Limited's (JSE:TKG) ownership, while institutions account for 32%
Key Insights
Significant control over Telkom SA SOC by state or government implies that the general public has more power to influence management and governance-related decisions
58% of the business is held by the top 2 shareholders
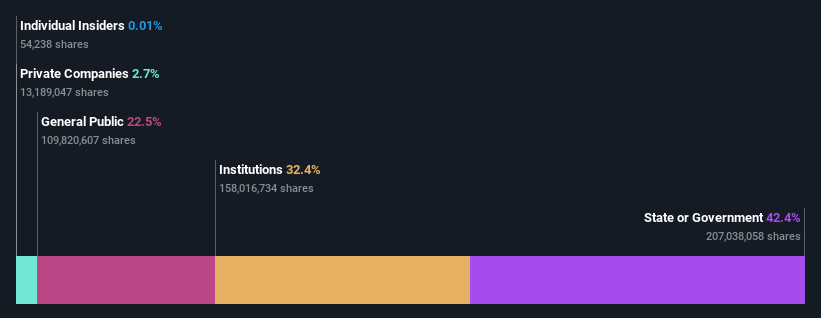
To get a sense of who is truly in control of Telkom SA SOC Limited (JSE:TKG), it is important to understand the ownership structure of the business. The group holding the most number of shares in the company, around 42% to be precise, is state or government. Put another way, the group faces the maximum upside potential (or downside risk).
Institutions, on the other hand, account for 32% of the company's stockholders. Generally speaking, as a company grows, institutions will increase their ownership. Conversely, insiders often decrease their ownership over time.
In the chart below, we zoom in on the different ownership groups of Telkom SA SOC.
View our latest analysis for Telkom SA SOC
What Does The Institutional Ownership Tell Us About Telkom SA SOC?
Institutional investors commonly compare their own returns to the returns of a commonly followed index. So they generally do consider buying larger companies that are included in the relevant benchmark index.
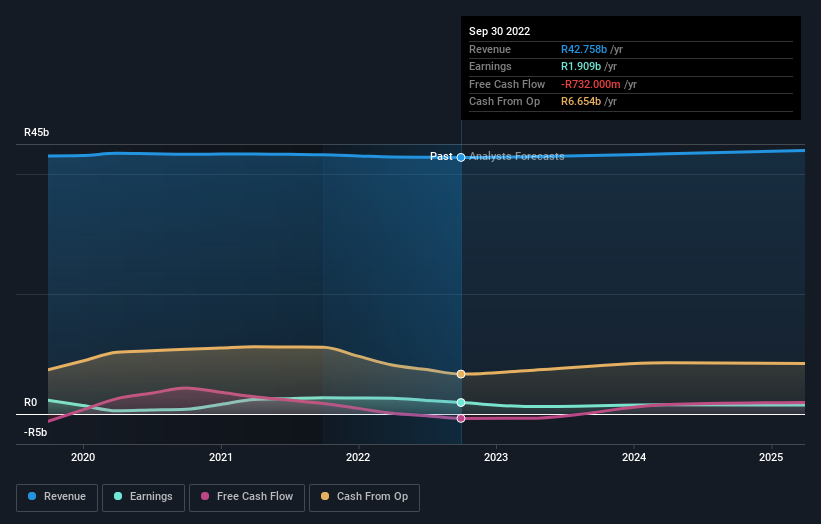
As you can see, institutional investors have a fair amount of stake in Telkom SA SOC. This implies the analysts working for those institutions have looked at the stock and they like it. But just like anyone else, they could be wrong. It is not uncommon to see a big share price drop if two large institutional investors try to sell out of a stock at the same time. So it is worth checking the past earnings trajectory of Telkom SA SOC, (below). Of course, keep in mind that there are other factors to consider, too.
Telkom SA SOC is not owned by hedge funds. South Africa is currently the company's largest shareholder with 42% of shares outstanding. Meanwhile, the second and third largest shareholders, hold 16% and 3.9%, of the shares outstanding, respectively.
After doing some more digging, we found that the top 2 shareholders collectively control more than half of the company's shares, implying that they have considerable power to influence the company's decisions.
While studying institutional ownership for a company can add value to your research, it is also a good practice to research analyst recommendations to get a deeper understand of a stock's expected performance. Quite a few analysts cover the stock, so you could look into forecast growth quite easily.
Insider Ownership Of Telkom SA SOC
The definition of an insider can differ slightly between different countries, but members of the board of directors always count. Management ultimately answers to the board. However, it is not uncommon for managers to be executive board members, especially if they are a founder or the CEO.
Insider ownership is positive when it signals leadership are thinking like the true owners of the company. However, high insider ownership can also give immense power to a small group within the company. This can be negative in some circumstances.
Our data suggests that insiders own under 1% of Telkom SA SOC Limited in their own names. However, it's possible that insiders might have an indirect interest through a more complex structure. It has a market capitalization of just R16b, and the board has only R1.8m worth of shares in their own names. Many tend to prefer to see a board with bigger shareholdings. A good next step might be to take a look at this free summary of insider buying and selling.
General Public Ownership
The general public-- including retail investors -- own 22% stake in the company, and hence can't easily be ignored. While this size of ownership may not be enough to sway a policy decision in their favour, they can still make a collective impact on company policies.
Next Steps:
While it is well worth considering the different groups that own a company, there are other factors that are even more important.
I like to dive deeper into how a company has performed in the past. You can find historic revenue and earnings in this detailed graph.
If you would prefer discover what analysts are predicting in terms of future growth, do not miss this free report on analyst forecasts.
NB: Figures in this article are calculated using data from the last twelve months, which refer to the 12-month period ending on the last date of the month the financial statement is dated. This may not be consistent with full year annual report figures.
Have feedback on this article? Concerned about the content? Get in touch with us directly. Alternatively, email editorial-team (at) simplywallst.com.
This article by Simply Wall St is general in nature. We provide commentary based on historical data and analyst forecasts only using an unbiased methodology and our articles are not intended to be financial advice. It does not constitute a recommendation to buy or sell any stock, and does not take account of your objectives, or your financial situation. We aim to bring you long-term focused analysis driven by fundamental data. Note that our analysis may not factor in the latest price-sensitive company announcements or qualitative material. Simply Wall St has no position in any stocks mentioned.
Join A Paid User Research Session
You’ll receive a US$30 Amazon Gift card for 1 hour of your time while helping us build better investing tools for the individual investors like yourself. Sign up here
