Is Steadfast Group Limited's (ASX:SDF) Latest Stock Performance Being Led By Its Strong Fundamentals?
Most readers would already know that Steadfast Group's (ASX:SDF) stock increased by 2.3% over the past week. Given its impressive performance, we decided to study the company's key financial indicators as a company's long-term fundamentals usually dictate market outcomes. In this article, we decided to focus on Steadfast Group's ROE.
Return on equity or ROE is an important factor to be considered by a shareholder because it tells them how effectively their capital is being reinvested. Simply put, it is used to assess the profitability of a company in relation to its equity capital.
Check out our latest analysis for Steadfast Group
How Do You Calculate Return On Equity?
The formula for ROE is:
Return on Equity = Net Profit (from continuing operations) ÷ Shareholders' Equity
So, based on the above formula, the ROE for Steadfast Group is:
11% = AU$199m ÷ AU$1.8b (Based on the trailing twelve months to December 2021).
The 'return' is the yearly profit. So, this means that for every A$1 of its shareholder's investments, the company generates a profit of A$0.11.
What Is The Relationship Between ROE And Earnings Growth?
So far, we've learned that ROE is a measure of a company's profitability. Depending on how much of these profits the company reinvests or "retains", and how effectively it does so, we are then able to assess a company’s earnings growth potential. Assuming everything else remains unchanged, the higher the ROE and profit retention, the higher the growth rate of a company compared to companies that don't necessarily bear these characteristics.
Steadfast Group's Earnings Growth And 11% ROE
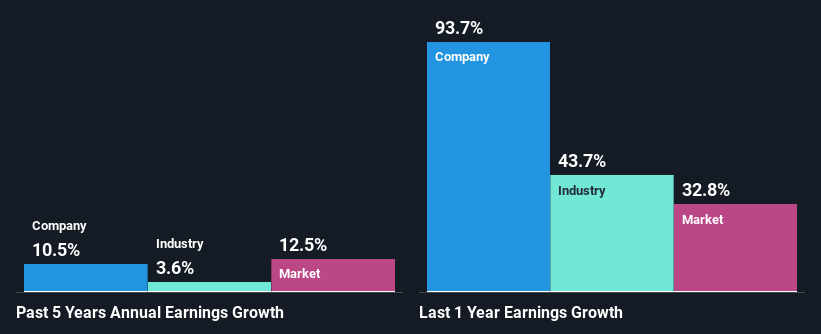
At first glance, Steadfast Group seems to have a decent ROE. And on comparing with the industry, we found that the the average industry ROE is similar at 9.9%. Consequently, this likely laid the ground for the decent growth of 10% seen over the past five years by Steadfast Group.
Next, on comparing with the industry net income growth, we found that Steadfast Group's growth is quite high when compared to the industry average growth of 3.6% in the same period, which is great to see.
Earnings growth is a huge factor in stock valuation. It’s important for an investor to know whether the market has priced in the company's expected earnings growth (or decline). This then helps them determine if the stock is placed for a bright or bleak future. What is SDF worth today? The intrinsic value infographic in our free research report helps visualize whether SDF is currently mispriced by the market.
Is Steadfast Group Efficiently Re-investing Its Profits?
The high three-year median payout ratio of 69% (or a retention ratio of 31%) for Steadfast Group suggests that the company's growth wasn't really hampered despite it returning most of its income to its shareholders.
Moreover, Steadfast Group is determined to keep sharing its profits with shareholders which we infer from its long history of eight years of paying a dividend. Our latest analyst data shows that the future payout ratio of the company over the next three years is expected to be approximately 65%. Accordingly, forecasts suggest that Steadfast Group's future ROE will be 13% which is again, similar to the current ROE.
Summary
In total, we are pretty happy with Steadfast Group's performance. Especially the high ROE, Which has contributed to the impressive growth seen in earnings. Despite the company reinvesting only a small portion of its profits, it still has managed to grow its earnings so that is appreciable. That being so, a study of the latest analyst forecasts show that the company is expected to see a slowdown in its future earnings growth. Are these analysts expectations based on the broad expectations for the industry, or on the company's fundamentals? Click here to be taken to our analyst's forecasts page for the company.
Have feedback on this article? Concerned about the content? Get in touch with us directly. Alternatively, email editorial-team (at) simplywallst.com.
This article by Simply Wall St is general in nature. We provide commentary based on historical data and analyst forecasts only using an unbiased methodology and our articles are not intended to be financial advice. It does not constitute a recommendation to buy or sell any stock, and does not take account of your objectives, or your financial situation. We aim to bring you long-term focused analysis driven by fundamental data. Note that our analysis may not factor in the latest price-sensitive company announcements or qualitative material. Simply Wall St has no position in any stocks mentioned.
