Is Steadfast Group Limited's (ASX:SDF) Latest Stock Performance A Reflection Of Its Financial Health?
Most readers would already be aware that Steadfast Group's (ASX:SDF) stock increased significantly by 11% over the past three months. Given that the market rewards strong financials in the long-term, we wonder if that is the case in this instance. Specifically, we decided to study Steadfast Group's ROE in this article.
Return on Equity or ROE is a test of how effectively a company is growing its value and managing investors’ money. In simpler terms, it measures the profitability of a company in relation to shareholder's equity.
View our latest analysis for Steadfast Group
How To Calculate Return On Equity?
Return on equity can be calculated by using the formula:
Return on Equity = Net Profit (from continuing operations) ÷ Shareholders' Equity
So, based on the above formula, the ROE for Steadfast Group is:
11% = AU$199m ÷ AU$1.8b (Based on the trailing twelve months to December 2021).
The 'return' is the profit over the last twelve months. So, this means that for every A$1 of its shareholder's investments, the company generates a profit of A$0.11.
Why Is ROE Important For Earnings Growth?
We have already established that ROE serves as an efficient profit-generating gauge for a company's future earnings. Depending on how much of these profits the company reinvests or "retains", and how effectively it does so, we are then able to assess a company’s earnings growth potential. Generally speaking, other things being equal, firms with a high return on equity and profit retention, have a higher growth rate than firms that don’t share these attributes.
Steadfast Group's Earnings Growth And 11% ROE
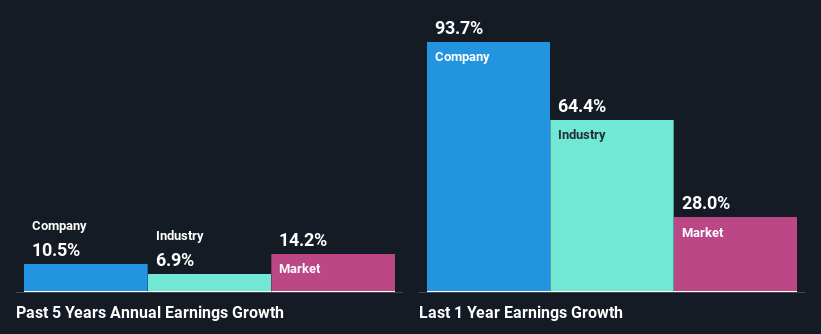
To begin with, Steadfast Group seems to have a respectable ROE. Even when compared to the industry average of 9.9% the company's ROE looks quite decent. This probably goes some way in explaining Steadfast Group's moderate 10% growth over the past five years amongst other factors.
As a next step, we compared Steadfast Group's net income growth with the industry, and pleasingly, we found that the growth seen by the company is higher than the average industry growth of 6.9%.
Earnings growth is a huge factor in stock valuation. It’s important for an investor to know whether the market has priced in the company's expected earnings growth (or decline). Doing so will help them establish if the stock's future looks promising or ominous. Has the market priced in the future outlook for SDF? You can find out in our latest intrinsic value infographic research report.
Is Steadfast Group Efficiently Re-investing Its Profits?
The high three-year median payout ratio of 69% (or a retention ratio of 31%) for Steadfast Group suggests that the company's growth wasn't really hampered despite it returning most of its income to its shareholders.
Besides, Steadfast Group has been paying dividends over a period of eight years. This shows that the company is committed to sharing profits with its shareholders. Based on the latest analysts' estimates, we found that the company's future payout ratio over the next three years is expected to hold steady at 64%. Therefore, the company's future ROE is also not expected to change by much with analysts predicting an ROE of 12%.
Conclusion
Overall, we are quite pleased with Steadfast Group's performance. Especially the high ROE, Which has contributed to the impressive growth seen in earnings. Despite the company reinvesting only a small portion of its profits, it still has managed to grow its earnings so that is appreciable. Having said that, the company's earnings growth is expected to slow down, as forecasted in the current analyst estimates. Are these analysts expectations based on the broad expectations for the industry, or on the company's fundamentals? Click here to be taken to our analyst's forecasts page for the company.
Have feedback on this article? Concerned about the content? Get in touch with us directly. Alternatively, email editorial-team (at) simplywallst.com.
This article by Simply Wall St is general in nature. We provide commentary based on historical data and analyst forecasts only using an unbiased methodology and our articles are not intended to be financial advice. It does not constitute a recommendation to buy or sell any stock, and does not take account of your objectives, or your financial situation. We aim to bring you long-term focused analysis driven by fundamental data. Note that our analysis may not factor in the latest price-sensitive company announcements or qualitative material. Simply Wall St has no position in any stocks mentioned.
Join A Paid User Research Session
You’ll receive a US$30 Amazon Gift card for 1 hour of your time while helping us build better investing tools for the individual investors like yourself. Sign up here
