Stock Yards Bancorp Inc's Dividend Analysis
An In-Depth Look at SYBT's Dividend Sustainability and Growth
Stock Yards Bancorp Inc (NASDAQ:SYBT) recently announced a dividend of $0.3 per share, payable on 2023-12-29, with the ex-dividend date set for 2023-12-15. As investors look forward to this upcoming payment, the spotlight also shines on the company's dividend history, yield, and growth rates. Using the data from GuruFocus, let's look into Stock Yards Bancorp Inc's dividend performance and assess its sustainability.
Understanding Stock Yards Bancorp Inc's Business
This Powerful Chart Made Peter Lynch 29% A Year For 13 Years
How to calculate the intrinsic value of a stock?
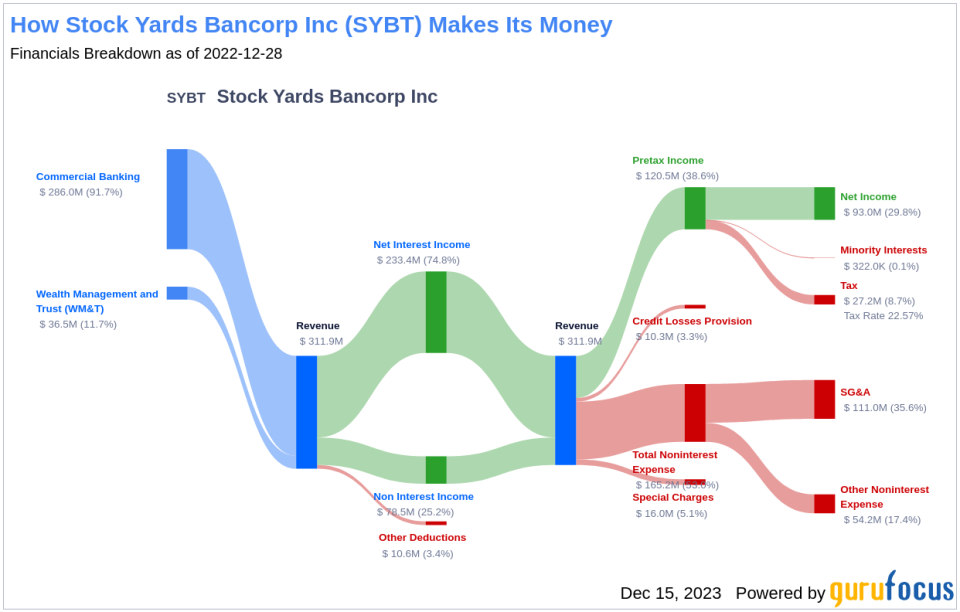
Stock Yards Bancorp Inc operates as a bank, with two primary operating segments: Commercial Banking and Wealth Management and Trust. The company's suite of services encompasses loan and deposit services, cash management, securities brokerage activities, mortgage origination, and more. The lion's share of Stock Yards Bancorp Inc's revenue is derived from its Commercial Banking segment.
Stock Yards Bancorp Inc's Dividend History
Stock Yards Bancorp Inc has maintained a consistent dividend payment record since 1992, distributing dividends quarterly. The company has demonstrated a commitment to increasing its dividend each year since 1992, earning it the prestigious title of a dividend aristocrata recognition given to companies that have consistently increased their dividend for at least 31 years. Below is a chart showing annual Dividends Per Share to track historical trends.
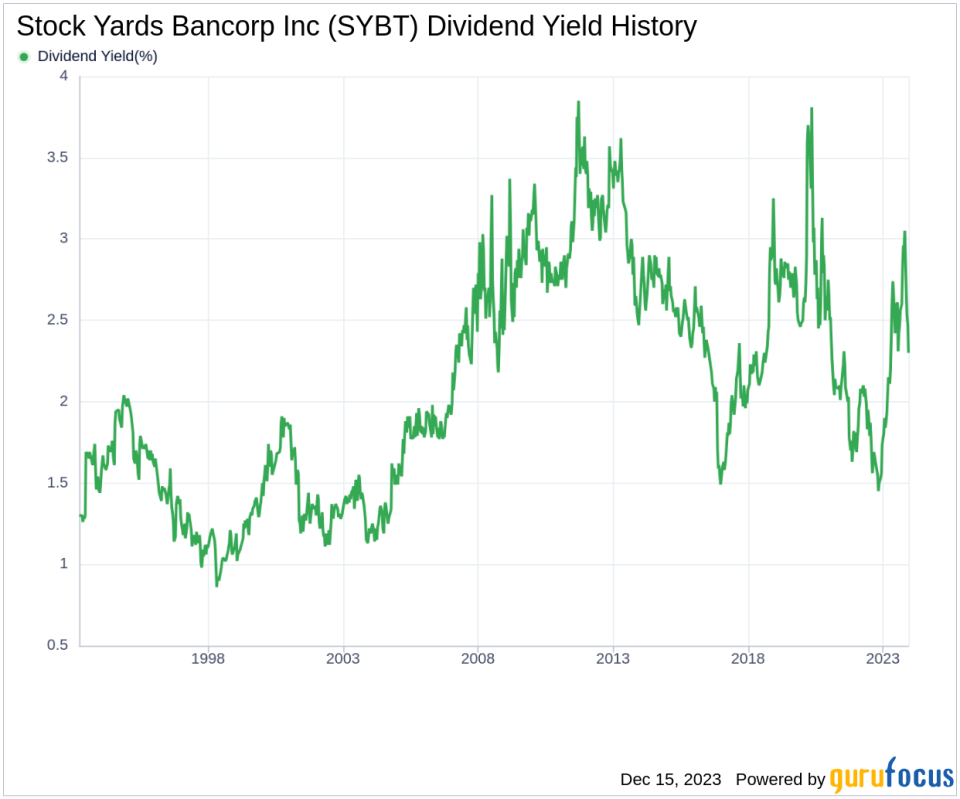
Examining Dividend Yield and Growth
As of today, Stock Yards Bancorp Inc's trailing dividend yield stands at 2.27%, with a forward dividend yield of 2.33%, indicating anticipated dividend increases over the next 12 months. Over the past three years, the annual dividend growth rate was 3.10%, which expands to 6.50% over a five-year period, and 9.50% over the last decade. The 5-year yield on cost for Stock Yards Bancorp Inc stock is approximately 3.11% as of today, factoring in the dividend yield and five-year growth rate.
Dividend Sustainability: Payout Ratio and Profitability
To evaluate dividend sustainability, the dividend payout ratio is a key metric, indicating the proportion of earnings allocated to dividends. A lower ratio suggests a balance between distributing profits and retaining earnings for growth. As of 2023-09-30, Stock Yards Bancorp Inc's dividend payout ratio is 0.30.
Additionally, the company's profitability rank is 6 out of 10, reflecting fair profitability compared to peers. With a consistent track record of positive net income over the past decade, Stock Yards Bancorp Inc's financial health appears solid.
Future Growth Prospects
Stock Yards Bancorp Inc's growth rank stands at 6 out of 10, suggesting a fair growth outlook. The company's revenue per share and 3-year revenue growth rate of 12.90% per year outperform approximately 77.46% of global competitors.
The 3-year EPS growth rate of 7.40% per year outperforms approximately 46.64% of global competitors, and the 5-year EBITDA growth rate of 15.30% outperforms approximately 72.59% of global competitors, indicating a robust capacity to sustain dividends.
Concluding Thoughts on Stock Yards Bancorp Inc's Dividend Profile
Considering Stock Yards Bancorp Inc's consistent dividend payments, an impressive growth rate in dividends per share, a moderate payout ratio, fair profitability, and promising growth metrics, the company presents an attractive profile for value investors interested in reliable dividend income. While the past performance is reassuring, investors should also keep an eye on the company's future earnings and growth potential to ensure the sustainability of dividends. For those seeking high-dividend yield stocks, GuruFocus Premium offers a High Dividend Yield Screener to discover similar investment opportunities.
This article, generated by GuruFocus, is designed to provide general insights and is not tailored financial advice. Our commentary is rooted in historical data and analyst projections, utilizing an impartial methodology, and is not intended to serve as specific investment guidance. It does not formulate a recommendation to purchase or divest any stock and does not consider individual investment objectives or financial circumstances. Our objective is to deliver long-term, fundamental data-driven analysis. Be aware that our analysis might not incorporate the most recent, price-sensitive company announcements or qualitative information. GuruFocus holds no position in the stocks mentioned herein.
This article first appeared on GuruFocus.
