The Strandline Resources (ASX:STA) Share Price Is Down 64% So Some Shareholders Are Wishing They Sold

Want to participate in a research study? Help shape the future of investing tools and earn a $60 gift card!
Generally speaking long term investing is the way to go. But no-one is immune from buying too high. For example, after five long years the Strandline Resources Limited (ASX:STA) share price is a whole 64% lower. That is extremely sub-optimal, to say the least. We also note that the stock has performed poorly over the last year, with the share price down 21%. Furthermore, it's down 10% in about a quarter. That's not much fun for holders.
View our latest analysis for Strandline Resources
We don't think Strandline Resources's revenue of AU$218,314 is enough to establish significant demand. You have to wonder why venture capitalists aren't funding it. As a result, we think it's unlikely shareholders are paying much attention to current revenue, but rather speculating on growth in the years to come. For example, investors may be hoping that Strandline Resources finds some valuable resources, before it runs out of money.
We think companies that have neither significant revenues nor profits are pretty high risk. The is usually a significant chance that they will need more money for business development, putting them at the mercy of capital markets. So the share price itself impacts the value of the shares (as it determines the cost of capital). While some such companies do very well over the long term, others become hyped up by promoters before eventually falling back down to earth, and going bankrupt (or being recapitalized). Some Strandline Resources investors have already had a taste of the bitterness stocks like this can leave in the mouth.
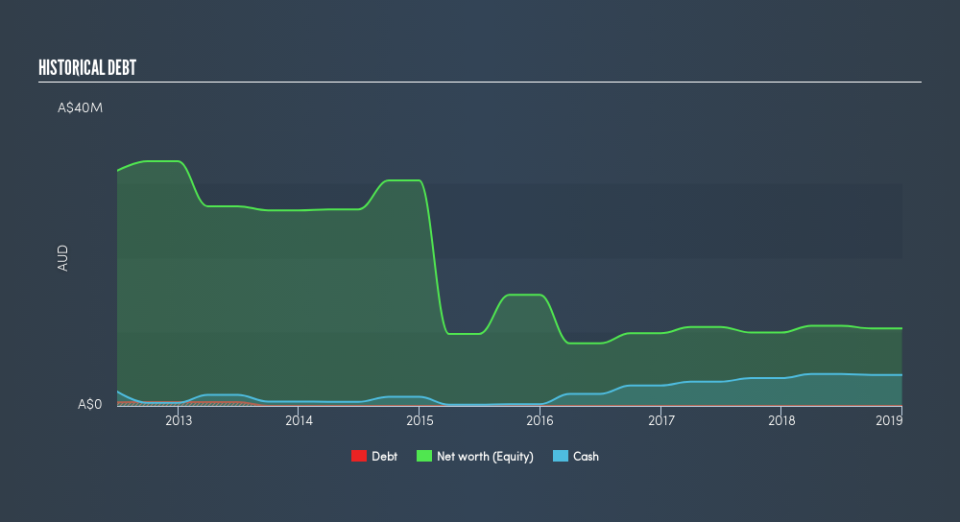
Strandline Resources had net cash of just AU$2.6m when it last reported (December 2018). So if it has not already moved to replenish reserves, we think the near-term chances of a capital raising event are pretty high. That probably explains why the share price is down 18% per year, over 5 years. You can click on the image below to see (in greater detail) how Strandline Resources's cash and debt levels have changed over time.
In reality it's hard to have much certainty when valuing a business that has neither revenue or profit. What if insiders are ditching the stock hand over fist? It would bother me, that's for sure. You can click here to see if there are insiders selling.
What about the Total Shareholder Return (TSR)?
We've already covered Strandline Resources's share price action, but we should also mention its total shareholder return (TSR). The TSR is a return calculation that accounts for the value of cash dividends (assuming that any dividend received was reinvested) and the calculated value of any discounted capital raisings and spin-offs. We note that Strandline Resources's TSR, at -59% is higher than its share price return of -64%. When you consider it hasn't been paying a dividend, this data suggests shareholders have benefitted from a spin-off, or had the opportunity to acquire attractively priced shares in a discounted capital raising.
A Different Perspective
While the broader market gained around 13% in the last year, Strandline Resources shareholders lost 21%. Even the share prices of good stocks drop sometimes, but we want to see improvements in the fundamental metrics of a business, before getting too interested. Regrettably, last year's performance caps off a bad run, with the shareholders facing a total loss of 16% per year over five years. Generally speaking long term share price weakness can be a bad sign, though contrarian investors might want to research the stock in hope of a turnaround. Most investors take the time to check the data on insider transactions. You can click here to see if insiders have been buying or selling.
If you like to buy stocks alongside management, then you might just love this free list of companies. (Hint: insiders have been buying them).
Please note, the market returns quoted in this article reflect the market weighted average returns of stocks that currently trade on AU exchanges.
We aim to bring you long-term focused research analysis driven by fundamental data. Note that our analysis may not factor in the latest price-sensitive company announcements or qualitative material.
If you spot an error that warrants correction, please contact the editor at editorial-team@simplywallst.com. This article by Simply Wall St is general in nature. It does not constitute a recommendation to buy or sell any stock, and does not take account of your objectives, or your financial situation. Simply Wall St has no position in the stocks mentioned. Thank you for reading.
