Strix Group (LON:KETL) investors are sitting on a loss of 71% if they invested three years ago
As every investor would know, not every swing hits the sweet spot. But really big losses can really drag down an overall portfolio. So consider, for a moment, the misfortune of Strix Group Plc (LON:KETL) investors who have held the stock for three years as it declined a whopping 74%. That might cause some serious doubts about the merits of the initial decision to buy the stock, to put it mildly. And over the last year the share price fell 43%, so we doubt many shareholders are delighted. Shareholders have had an even rougher run lately, with the share price down 38% in the last 90 days.
With that in mind, it's worth seeing if the company's underlying fundamentals have been the driver of long term performance, or if there are some discrepancies.
View our latest analysis for Strix Group
To paraphrase Benjamin Graham: Over the short term the market is a voting machine, but over the long term it's a weighing machine. One flawed but reasonable way to assess how sentiment around a company has changed is to compare the earnings per share (EPS) with the share price.
Strix Group saw its EPS decline at a compound rate of 20% per year, over the last three years. The share price decline of 36% is actually steeper than the EPS slippage. So it's likely that the EPS decline has disappointed the market, leaving investors hesitant to buy. The less favorable sentiment is reflected in its current P/E ratio of 9.84.
The image below shows how EPS has tracked over time (if you click on the image you can see greater detail).
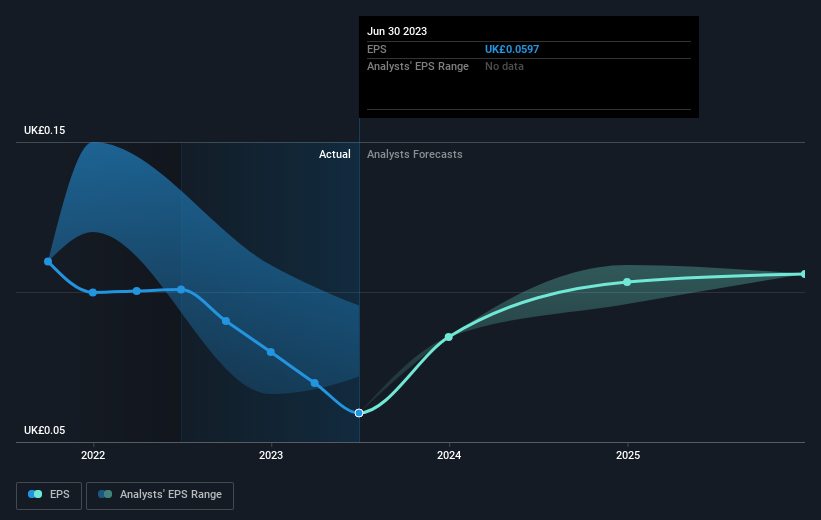
Dive deeper into Strix Group's key metrics by checking this interactive graph of Strix Group's earnings, revenue and cash flow.
What About Dividends?
When looking at investment returns, it is important to consider the difference between total shareholder return (TSR) and share price return. Whereas the share price return only reflects the change in the share price, the TSR includes the value of dividends (assuming they were reinvested) and the benefit of any discounted capital raising or spin-off. Arguably, the TSR gives a more comprehensive picture of the return generated by a stock. We note that for Strix Group the TSR over the last 3 years was -71%, which is better than the share price return mentioned above. This is largely a result of its dividend payments!
A Different Perspective
Investors in Strix Group had a tough year, with a total loss of 41% (including dividends), against a market gain of about 5.0%. Even the share prices of good stocks drop sometimes, but we want to see improvements in the fundamental metrics of a business, before getting too interested. Unfortunately, last year's performance may indicate unresolved challenges, given that it was worse than the annualised loss of 9% over the last half decade. Generally speaking long term share price weakness can be a bad sign, though contrarian investors might want to research the stock in hope of a turnaround. It's always interesting to track share price performance over the longer term. But to understand Strix Group better, we need to consider many other factors. For instance, we've identified 5 warning signs for Strix Group (1 is significant) that you should be aware of.
If you like to buy stocks alongside management, then you might just love this free list of companies. (Hint: insiders have been buying them).
Please note, the market returns quoted in this article reflect the market weighted average returns of stocks that currently trade on British exchanges.
Have feedback on this article? Concerned about the content? Get in touch with us directly. Alternatively, email editorial-team (at) simplywallst.com.
This article by Simply Wall St is general in nature. We provide commentary based on historical data and analyst forecasts only using an unbiased methodology and our articles are not intended to be financial advice. It does not constitute a recommendation to buy or sell any stock, and does not take account of your objectives, or your financial situation. We aim to bring you long-term focused analysis driven by fundamental data. Note that our analysis may not factor in the latest price-sensitive company announcements or qualitative material. Simply Wall St has no position in any stocks mentioned.
