Are Strong Financial Prospects The Force That Is Driving The Momentum In The St. Joe Company's NYSE:JOE) Stock?
Most readers would already be aware that St. Joe's (NYSE:JOE) stock increased significantly by 16% over the past month. Since the market usually pay for a company’s long-term fundamentals, we decided to study the company’s key performance indicators to see if they could be influencing the market. Particularly, we will be paying attention to St. Joe's ROE today.
Return on Equity or ROE is a test of how effectively a company is growing its value and managing investors’ money. In short, ROE shows the profit each dollar generates with respect to its shareholder investments.
View our latest analysis for St. Joe
How Do You Calculate Return On Equity?
The formula for return on equity is:
Return on Equity = Net Profit (from continuing operations) ÷ Shareholders' Equity
So, based on the above formula, the ROE for St. Joe is:
13% = US$90m ÷ US$694m (Based on the trailing twelve months to September 2023).
The 'return' is the yearly profit. That means that for every $1 worth of shareholders' equity, the company generated $0.13 in profit.
Why Is ROE Important For Earnings Growth?
Thus far, we have learned that ROE measures how efficiently a company is generating its profits. Based on how much of its profits the company chooses to reinvest or "retain", we are then able to evaluate a company's future ability to generate profits. Generally speaking, other things being equal, firms with a high return on equity and profit retention, have a higher growth rate than firms that don’t share these attributes.
St. Joe's Earnings Growth And 13% ROE
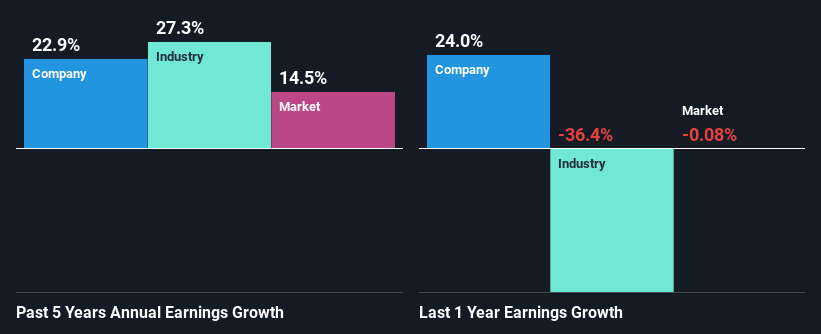
At first glance, St. Joe seems to have a decent ROE. On comparing with the average industry ROE of 7.1% the company's ROE looks pretty remarkable. This certainly adds some context to St. Joe's exceptional 23% net income growth seen over the past five years. We believe that there might also be other aspects that are positively influencing the company's earnings growth. Such as - high earnings retention or an efficient management in place.
As a next step, we compared St. Joe's net income growth with the industry and found that the company has a similar growth figure when compared with the industry average growth rate of 27% in the same period.
The basis for attaching value to a company is, to a great extent, tied to its earnings growth. It’s important for an investor to know whether the market has priced in the company's expected earnings growth (or decline). This then helps them determine if the stock is placed for a bright or bleak future. If you're wondering about St. Joe's's valuation, check out this gauge of its price-to-earnings ratio, as compared to its industry.
Is St. Joe Efficiently Re-investing Its Profits?
The three-year median payout ratio for St. Joe is 27%, which is moderately low. The company is retaining the remaining 73%. By the looks of it, the dividend is well covered and St. Joe is reinvesting its profits efficiently as evidenced by its exceptional growth which we discussed above.
Besides, St. Joe has been paying dividends over a period of three years. This shows that the company is committed to sharing profits with its shareholders.
Summary
Overall, we are quite pleased with St. Joe's performance. In particular, it's great to see that the company is investing heavily into its business and along with a high rate of return, that has resulted in a sizeable growth in its earnings. If the company continues to grow its earnings the way it has, that could have a positive impact on its share price given how earnings per share influence long-term share prices. Let's not forget, business risk is also one of the factors that affects the price of the stock. So this is also an important area that investors need to pay attention to before making a decision on any business. You can see the 1 risk we have identified for St. Joe by visiting our risks dashboard for free on our platform here.
Have feedback on this article? Concerned about the content? Get in touch with us directly. Alternatively, email editorial-team (at) simplywallst.com.
This article by Simply Wall St is general in nature. We provide commentary based on historical data and analyst forecasts only using an unbiased methodology and our articles are not intended to be financial advice. It does not constitute a recommendation to buy or sell any stock, and does not take account of your objectives, or your financial situation. We aim to bring you long-term focused analysis driven by fundamental data. Note that our analysis may not factor in the latest price-sensitive company announcements or qualitative material. Simply Wall St has no position in any stocks mentioned.
