Are Strong Financial Prospects The Force That Is Driving The Momentum In Dillard's, Inc.'s NYSE:DDS) Stock?
Dillard's (NYSE:DDS) has had a great run on the share market with its stock up by a significant 21% over the last month. Given the company's impressive performance, we decided to study its financial indicators more closely as a company's financial health over the long-term usually dictates market outcomes. In this article, we decided to focus on Dillard's' ROE.
Return on equity or ROE is a key measure used to assess how efficiently a company's management is utilizing the company's capital. In simpler terms, it measures the profitability of a company in relation to shareholder's equity.
See our latest analysis for Dillard's
How Do You Calculate Return On Equity?
The formula for ROE is:
Return on Equity = Net Profit (from continuing operations) ÷ Shareholders' Equity
So, based on the above formula, the ROE for Dillard's is:
50% = US$842m ÷ US$1.7b (Based on the trailing twelve months to April 2023).
The 'return' is the yearly profit. That means that for every $1 worth of shareholders' equity, the company generated $0.50 in profit.
What Has ROE Got To Do With Earnings Growth?
Thus far, we have learned that ROE measures how efficiently a company is generating its profits. Depending on how much of these profits the company reinvests or "retains", and how effectively it does so, we are then able to assess a company’s earnings growth potential. Assuming everything else remains unchanged, the higher the ROE and profit retention, the higher the growth rate of a company compared to companies that don't necessarily bear these characteristics.
A Side By Side comparison of Dillard's' Earnings Growth And 50% ROE
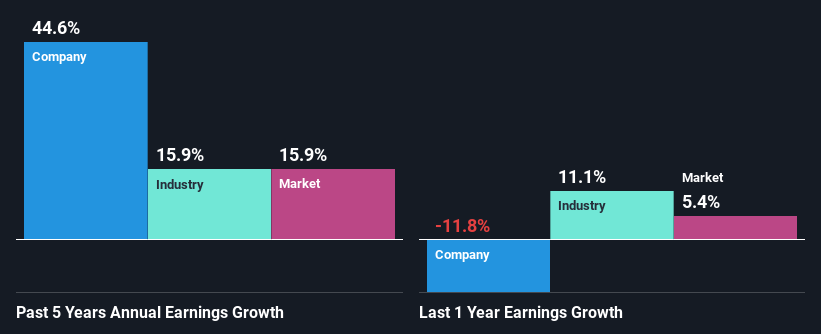
First thing first, we like that Dillard's has an impressive ROE. Additionally, the company's ROE is higher compared to the industry average of 11% which is quite remarkable. So, the substantial 45% net income growth seen by Dillard's over the past five years isn't overly surprising.
Next, on comparing with the industry net income growth, we found that Dillard's' growth is quite high when compared to the industry average growth of 16% in the same period, which is great to see.
Earnings growth is a huge factor in stock valuation. What investors need to determine next is if the expected earnings growth, or the lack of it, is already built into the share price. By doing so, they will have an idea if the stock is headed into clear blue waters or if swampy waters await. Has the market priced in the future outlook for DDS? You can find out in our latest intrinsic value infographic research report.
Is Dillard's Efficiently Re-investing Its Profits?
Dillard's has a really low three-year median payout ratio of 1.6%, meaning that it has the remaining 98% left over to reinvest into its business. So it looks like Dillard's is reinvesting profits heavily to grow its business, which shows in its earnings growth.
Additionally, Dillard's has paid dividends over a period of at least ten years which means that the company is pretty serious about sharing its profits with shareholders.
Conclusion
On the whole, we feel that Dillard's' performance has been quite good. Specifically, we like that the company is reinvesting a huge chunk of its profits at a high rate of return. This of course has caused the company to see substantial growth in its earnings. With that said, on studying the latest analyst forecasts, we found that while the company has seen growth in its past earnings, analysts expect its future earnings to shrink. To know more about the company's future earnings growth forecasts take a look at this free report on analyst forecasts for the company to find out more.
Have feedback on this article? Concerned about the content? Get in touch with us directly. Alternatively, email editorial-team (at) simplywallst.com.
This article by Simply Wall St is general in nature. We provide commentary based on historical data and analyst forecasts only using an unbiased methodology and our articles are not intended to be financial advice. It does not constitute a recommendation to buy or sell any stock, and does not take account of your objectives, or your financial situation. We aim to bring you long-term focused analysis driven by fundamental data. Note that our analysis may not factor in the latest price-sensitive company announcements or qualitative material. Simply Wall St has no position in any stocks mentioned.
Join A Paid User Research Session
You’ll receive a US$30 Amazon Gift card for 1 hour of your time while helping us build better investing tools for the individual investors like yourself. Sign up here
