Are Strong Financial Prospects The Force That Is Driving The Momentum In Johns Lyng Group Limited's ASX:JLG) Stock?
Johns Lyng Group's (ASX:JLG) stock is up by a considerable 11% over the past month. Given that the market rewards strong financials in the long-term, we wonder if that is the case in this instance. Specifically, we decided to study Johns Lyng Group's ROE in this article.
Return on equity or ROE is a key measure used to assess how efficiently a company's management is utilizing the company's capital. Simply put, it is used to assess the profitability of a company in relation to its equity capital.
Check out our latest analysis for Johns Lyng Group
How To Calculate Return On Equity?
The formula for ROE is:
Return on Equity = Net Profit (from continuing operations) ÷ Shareholders' Equity
So, based on the above formula, the ROE for Johns Lyng Group is:
16% = AU$63m ÷ AU$394m (Based on the trailing twelve months to June 2023).
The 'return' is the yearly profit. So, this means that for every A$1 of its shareholder's investments, the company generates a profit of A$0.16.
What Has ROE Got To Do With Earnings Growth?
So far, we've learned that ROE is a measure of a company's profitability. We now need to evaluate how much profit the company reinvests or "retains" for future growth which then gives us an idea about the growth potential of the company. Assuming all else is equal, companies that have both a higher return on equity and higher profit retention are usually the ones that have a higher growth rate when compared to companies that don't have the same features.
Johns Lyng Group's Earnings Growth And 16% ROE
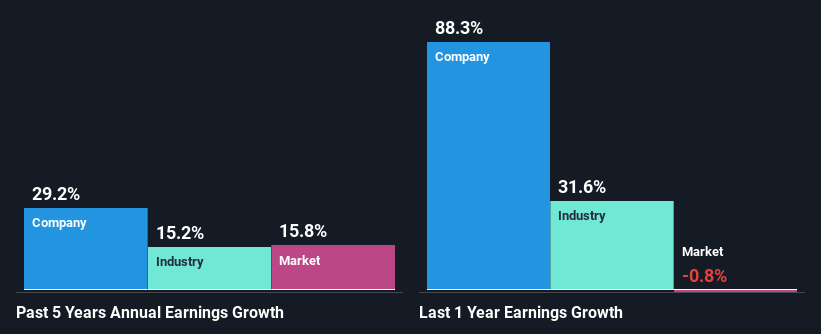
To begin with, Johns Lyng Group seems to have a respectable ROE. On comparing with the average industry ROE of 12% the company's ROE looks pretty remarkable. This certainly adds some context to Johns Lyng Group's exceptional 29% net income growth seen over the past five years. However, there could also be other causes behind this growth. Such as - high earnings retention or an efficient management in place.
Next, on comparing with the industry net income growth, we found that Johns Lyng Group's growth is quite high when compared to the industry average growth of 15% in the same period, which is great to see.
Earnings growth is an important metric to consider when valuing a stock. The investor should try to establish if the expected growth or decline in earnings, whichever the case may be, is priced in. By doing so, they will have an idea if the stock is headed into clear blue waters or if swampy waters await. Has the market priced in the future outlook for JLG? You can find out in our latest intrinsic value infographic research report.
Is Johns Lyng Group Making Efficient Use Of Its Profits?
Johns Lyng Group's significant three-year median payout ratio of 56% (where it is retaining only 44% of its income) suggests that the company has been able to achieve a high growth in earnings despite returning most of its income to shareholders.
Additionally, Johns Lyng Group has paid dividends over a period of five years which means that the company is pretty serious about sharing its profits with shareholders. Based on the latest analysts' estimates, we found that the company's future payout ratio over the next three years is expected to hold steady at 45%. Accordingly, forecasts suggest that Johns Lyng Group's future ROE will be 14% which is again, similar to the current ROE.
Summary
Overall, we are quite pleased with Johns Lyng Group's performance. Especially the high ROE, Which has contributed to the impressive growth seen in earnings. Despite the company reinvesting only a small portion of its profits, it still has managed to grow its earnings so that is appreciable. That being so, a study of the latest analyst forecasts show that the company is expected to see a slowdown in its future earnings growth. To know more about the company's future earnings growth forecasts take a look at this free report on analyst forecasts for the company to find out more.
Have feedback on this article? Concerned about the content? Get in touch with us directly. Alternatively, email editorial-team (at) simplywallst.com.
This article by Simply Wall St is general in nature. We provide commentary based on historical data and analyst forecasts only using an unbiased methodology and our articles are not intended to be financial advice. It does not constitute a recommendation to buy or sell any stock, and does not take account of your objectives, or your financial situation. We aim to bring you long-term focused analysis driven by fundamental data. Note that our analysis may not factor in the latest price-sensitive company announcements or qualitative material. Simply Wall St has no position in any stocks mentioned.
