Strong week for Mayne Pharma Group (ASX:MYX) shareholders doesn't alleviate pain of five-year loss
This week we saw the Mayne Pharma Group Limited (ASX:MYX) share price climb by 10%. But spare a thought for the long term holders, who have held the stock as it bled value over the last five years. Five years have seen the share price descend precipitously, down a full 84%. It's true that the recent bounce could signal the company is turning over a new leaf, but we are not so sure. The real question is whether the business can leave its past behind and improve itself over the years ahead. We really feel for shareholders in this scenario. It's a good reminder of the importance of diversification, and it's worth keeping in mind there's more to life than money, anyway.
While the stock has risen 10% in the past week but long term shareholders are still in the red, let's see what the fundamentals can tell us.
View our latest analysis for Mayne Pharma Group
Mayne Pharma Group isn't currently profitable, so most analysts would look to revenue growth to get an idea of how fast the underlying business is growing. Generally speaking, companies without profits are expected to grow revenue every year, and at a good clip. As you can imagine, fast revenue growth, when maintained, often leads to fast profit growth.
Over half a decade Mayne Pharma Group reduced its trailing twelve month revenue by 18% for each year. That's definitely a weaker result than most pre-profit companies report. So it's not altogether surprising to see the share price down 13% per year in the same time period. This kind of price performance makes us very wary, especially when combined with falling revenue. Ironically, that behavior could create an opportunity for the contrarian investor - but only if there are good reasons to predict a brighter future.
You can see below how earnings and revenue have changed over time (discover the exact values by clicking on the image).
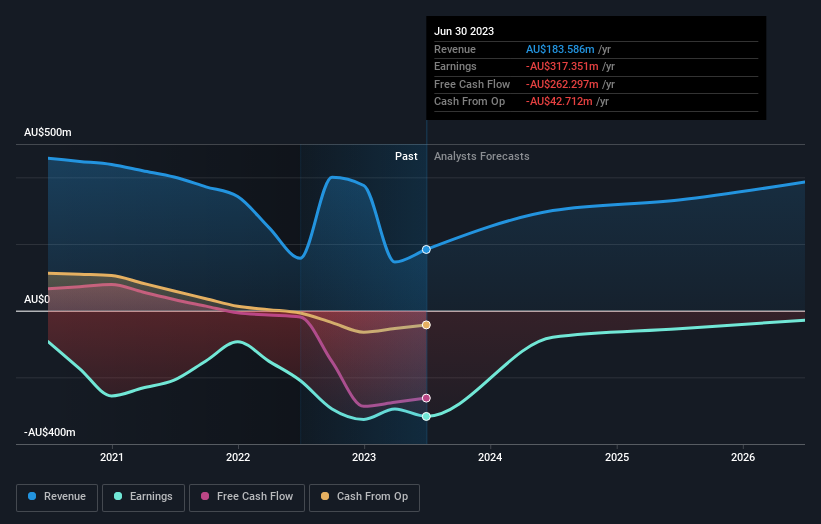
We consider it positive that insiders have made significant purchases in the last year. Having said that, most people consider earnings and revenue growth trends to be a more meaningful guide to the business. So it makes a lot of sense to check out what analysts think Mayne Pharma Group will earn in the future (free profit forecasts).
What About The Total Shareholder Return (TSR)?
We've already covered Mayne Pharma Group's share price action, but we should also mention its total shareholder return (TSR). Arguably the TSR is a more complete return calculation because it accounts for the value of dividends (as if they were reinvested), along with the hypothetical value of any discounted capital that have been offered to shareholders. Mayne Pharma Group hasn't been paying dividends, but its TSR of -82% exceeds its share price return of -84%, implying it has either spun-off a business, or raised capital at a discount; thereby providing additional value to shareholders.
A Different Perspective
Mayne Pharma Group shareholders are down 34% for the year, but the market itself is up 7.0%. Even the share prices of good stocks drop sometimes, but we want to see improvements in the fundamental metrics of a business, before getting too interested. Unfortunately, last year's performance may indicate unresolved challenges, given that it was worse than the annualised loss of 13% over the last half decade. Generally speaking long term share price weakness can be a bad sign, though contrarian investors might want to research the stock in hope of a turnaround. It's always interesting to track share price performance over the longer term. But to understand Mayne Pharma Group better, we need to consider many other factors. To that end, you should be aware of the 2 warning signs we've spotted with Mayne Pharma Group .
There are plenty of other companies that have insiders buying up shares. You probably do not want to miss this free list of growing companies that insiders are buying.
Please note, the market returns quoted in this article reflect the market weighted average returns of stocks that currently trade on Australian exchanges.
Have feedback on this article? Concerned about the content? Get in touch with us directly. Alternatively, email editorial-team (at) simplywallst.com.
This article by Simply Wall St is general in nature. We provide commentary based on historical data and analyst forecasts only using an unbiased methodology and our articles are not intended to be financial advice. It does not constitute a recommendation to buy or sell any stock, and does not take account of your objectives, or your financial situation. We aim to bring you long-term focused analysis driven by fundamental data. Note that our analysis may not factor in the latest price-sensitive company announcements or qualitative material. Simply Wall St has no position in any stocks mentioned.
