STV Group (LON:STVG) shareholders have endured a 33% loss from investing in the stock five years ago
In order to justify the effort of selecting individual stocks, it's worth striving to beat the returns from a market index fund. But every investor is virtually certain to have both over-performing and under-performing stocks. At this point some shareholders may be questioning their investment in STV Group plc (LON:STVG), since the last five years saw the share price fall 43%. And we doubt long term believers are the only worried holders, since the stock price has declined 29% over the last twelve months.
Since shareholders are down over the longer term, lets look at the underlying fundamentals over the that time and see if they've been consistent with returns.
See our latest analysis for STV Group
In his essay The Superinvestors of Graham-and-Doddsville Warren Buffett described how share prices do not always rationally reflect the value of a business. By comparing earnings per share (EPS) and share price changes over time, we can get a feel for how investor attitudes to a company have morphed over time.
While the share price declined over five years, STV Group actually managed to increase EPS by an average of 55% per year. Given the share price reaction, one might suspect that EPS is not a good guide to the business performance during the period (perhaps due to a one-off loss or gain). Or possibly, the market was previously very optimistic, so the stock has disappointed, despite improving EPS.
Because of the sharp contrast between the EPS growth rate and the share price growth, we're inclined to look to other metrics to understand the changing market sentiment around the stock.
The most recent dividend was actually lower than it was in the past, so that may have sent the share price lower.
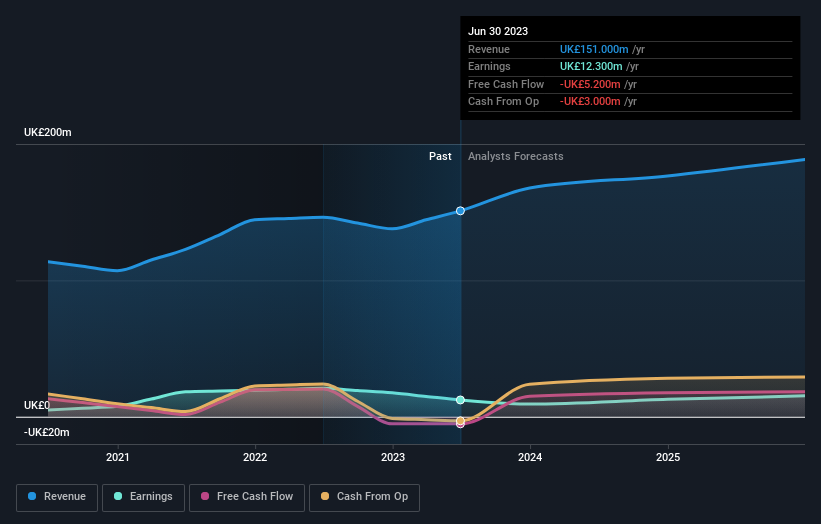
The company's revenue and earnings (over time) are depicted in the image below (click to see the exact numbers).
If you are thinking of buying or selling STV Group stock, you should check out this FREE detailed report on its balance sheet.
What About Dividends?
As well as measuring the share price return, investors should also consider the total shareholder return (TSR). Whereas the share price return only reflects the change in the share price, the TSR includes the value of dividends (assuming they were reinvested) and the benefit of any discounted capital raising or spin-off. It's fair to say that the TSR gives a more complete picture for stocks that pay a dividend. As it happens, STV Group's TSR for the last 5 years was -33%, which exceeds the share price return mentioned earlier. And there's no prize for guessing that the dividend payments largely explain the divergence!
A Different Perspective
While the broader market lost about 0.5% in the twelve months, STV Group shareholders did even worse, losing 25% (even including dividends). Having said that, it's inevitable that some stocks will be oversold in a falling market. The key is to keep your eyes on the fundamental developments. Regrettably, last year's performance caps off a bad run, with the shareholders facing a total loss of 6% per year over five years. We realise that Baron Rothschild has said investors should "buy when there is blood on the streets", but we caution that investors should first be sure they are buying a high quality business. While it is well worth considering the different impacts that market conditions can have on the share price, there are other factors that are even more important. Take risks, for example - STV Group has 5 warning signs (and 3 which make us uncomfortable) we think you should know about.
Of course, you might find a fantastic investment by looking elsewhere. So take a peek at this free list of companies we expect will grow earnings.
Please note, the market returns quoted in this article reflect the market weighted average returns of stocks that currently trade on British exchanges.
Have feedback on this article? Concerned about the content? Get in touch with us directly. Alternatively, email editorial-team (at) simplywallst.com.
This article by Simply Wall St is general in nature. We provide commentary based on historical data and analyst forecasts only using an unbiased methodology and our articles are not intended to be financial advice. It does not constitute a recommendation to buy or sell any stock, and does not take account of your objectives, or your financial situation. We aim to bring you long-term focused analysis driven by fundamental data. Note that our analysis may not factor in the latest price-sensitive company announcements or qualitative material. Simply Wall St has no position in any stocks mentioned.
