Is Sunnova Energy International Inc (NOVA) Set to Underperform? Analyzing the Factors Limiting ...
Long-established in the Semiconductors industry, Sunnova Energy International Inc (NYSE:NOVA) has enjoyed a stellar reputation. However, it has recently witnessed a daily loss of 7.23%, juxtaposed with a three-month change of -49.37%. Fresh insights from the GF Score hint at potential headwinds. Notably, its diminished rankings in financial strength, growth, and valuation suggest that the company might not live up to its historical performance. Join us as we dive deep into these pivotal metrics to unravel the evolving narrative of Sunnova Energy International Inc.
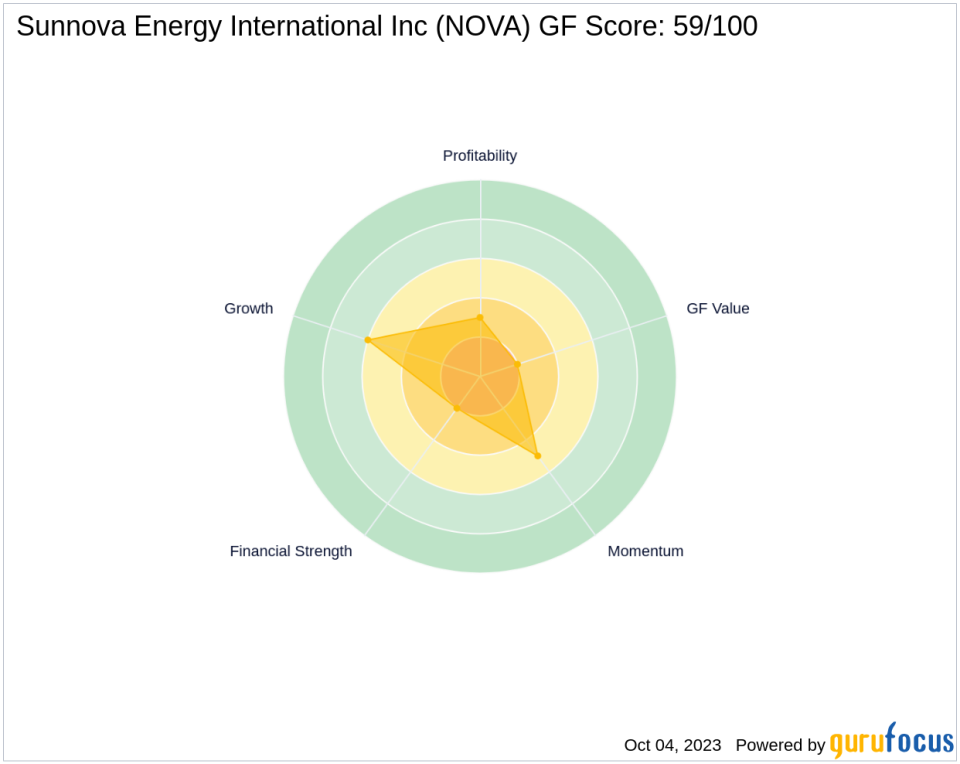
Understanding the GF Score
The GF Score is a stock performance ranking system developed by GuruFocus using five aspects of valuation, which has been found to be closely correlated to the long-term performances of stocks by backtesting from 2006 to 2021. The stocks with a higher GF Score generally generate higher returns than those with a lower GF Score. Therefore, when picking stocks, investors should invest in companies with high GF Scores. The GF Score ranges from 0 to 100, with 100 as the highest rank.
Financial strength rank: 2/10
Profitability rank: 3/10
Growth rank: 6/10
GF Value rank: 2/10
Momentum rank: 5/10
Based on the above method, GuruFocus assigned Sunnova Energy International Inc the GF Score of 59 out of 100, which signals poor future outperformance potential.
Company Snapshot: Sunnova Energy International Inc
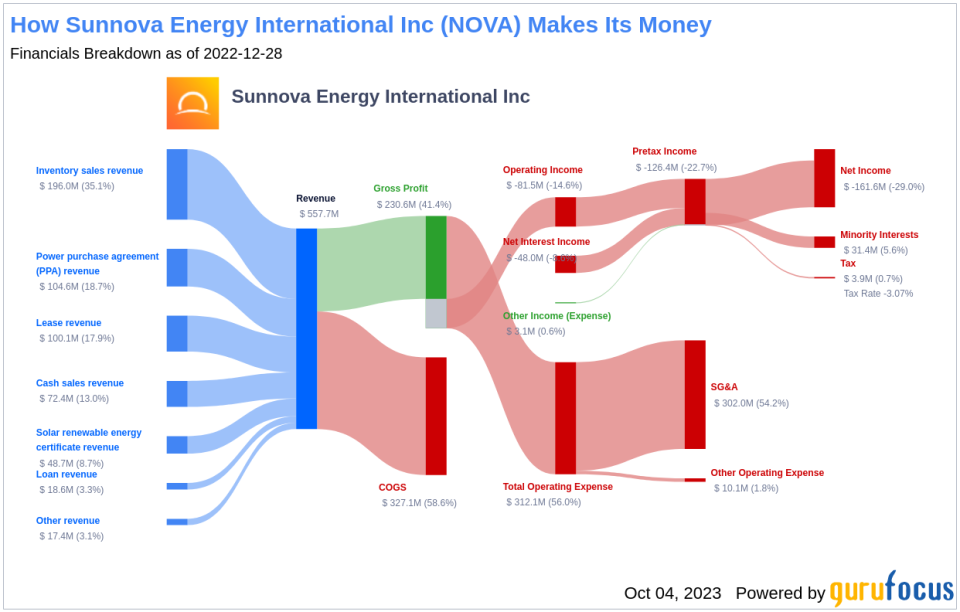
Sunnova Energy International Inc is a residential solar and energy storage service provider company with a market cap of $1.07 billion. It offers services such as operations and maintenance, monitoring, repairs and replacements, equipment upgrades, and onsite power optimization. The products and services offered by the group include Add-on battery storage, Home solar protection plans, New solar battery storage, and various other solar systems. However, with sales of $673.03 million and an operating margin of -22.75%, the company's financial health appears concerning.
Financial Strength Analysis
Sunnova Energy International Inc's financial strength indicators present some concerning insights about the company's balance sheet health. The company's interest coverage ratio of 0, positions it worse than 0% of 648 companies in the Semiconductors industry. This ratio highlights potential challenges the company might face when handling its interest expenses on outstanding debt. It's worth noting that the esteemed investor Benjamin Graham typically favored companies with an interest coverage ratio of at least five.
The company's Altman Z-Scoreis just 0.13, which is below the distress zone of 1.81. This suggests that the company may face financial distress over the next few years. Additionally, the company's low cash-to-debt ratio at 0.03 indicates a struggle in handling existing debt levels. The company's debt-to-equity ratio is 4.58, which is worse than 99.24% of 789 companies in the Semiconductors industry. A high debt-to-equity ratio suggests over-reliance on borrowing and vulnerability to market fluctuations. Additionally, the company's debt-to-Ebitda ratio is 73.58, which is above Joel Tillinghast's warning level of 4 and is worse than 99.1% of 670 companies in the Semiconductors industry. Tillinghast said in his book Big Money Think's Small: Biases, Blind Spots, and Smarter Investing that a high debt-to-Ebitda ratio can be a red flag unless tangible assets cover the debt.
Profitability Analysis
Sunnova Energy International Inc's low Profitability rank can also raise warning signals. Sunnova Energy International Inc's Operating Margin has declined over the past five years ((-14,610.00%)), as shown by the following data: 2018: -13.15; 2019: -16.93; 2020: -22.25; 2021: -22.71; 2022: -14.62. Additionally, Sunnova Energy International Inc's Gross Margin has also declined over the past five years, as evidenced by the data: 2018: 64.82; 2019: 63.96; 2020: 59.47; 2021: 59.34; 2022: 41.35. This trend underscores the company's struggles to convert its revenue into profits. With a Piotroski F-Score of 1, Sunnova Energy International Inc's financial health appears concerning. This score, rooted in Joseph Piotroski's nine-point scale, evaluates a firm's profitability, liquidity, and operating efficiency. Given its rating, Sunnova Energy International Inc might be facing challenges in these areas.
Conclusion
Given the company's financial strength, profitability, and growth metrics, the GF Score highlights the firm's unparalleled position for potential underperformance. While Sunnova Energy International Inc has a history of success in the Semiconductors industry, its current financial indicators suggest that it may struggle to maintain this performance in the future. Investors should consider these factors when making decisions about this stock.
GuruFocus Premium members can find more companies with strong GF Scores using the following screener link: GF Score Screen
This article first appeared on GuruFocus.
