Superior Group of Companies, Inc.'s (NASDAQ:SGC) Intrinsic Value Is Potentially 20% Below Its Share Price
Key Insights
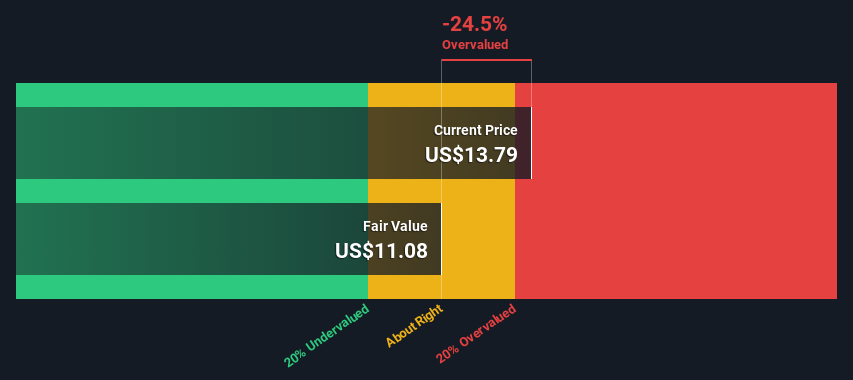
Using the 2 Stage Free Cash Flow to Equity, Superior Group of Companies fair value estimate is US$11.08
Current share price of US$13.79 suggests Superior Group of Companies is potentially 24% overvalued
Industry average of 10% suggests Superior Group of Companies' peers are currently trading at a lower premium to fair value
Today we'll do a simple run through of a valuation method used to estimate the attractiveness of Superior Group of Companies, Inc. (NASDAQ:SGC) as an investment opportunity by projecting its future cash flows and then discounting them to today's value. We will take advantage of the Discounted Cash Flow (DCF) model for this purpose. Believe it or not, it's not too difficult to follow, as you'll see from our example!
Remember though, that there are many ways to estimate a company's value, and a DCF is just one method. Anyone interested in learning a bit more about intrinsic value should have a read of the Simply Wall St analysis model.
Check out our latest analysis for Superior Group of Companies
The Method
We are going to use a two-stage DCF model, which, as the name states, takes into account two stages of growth. The first stage is generally a higher growth period which levels off heading towards the terminal value, captured in the second 'steady growth' period. To start off with, we need to estimate the next ten years of cash flows. Where possible we use analyst estimates, but when these aren't available we extrapolate the previous free cash flow (FCF) from the last estimate or reported value. We assume companies with shrinking free cash flow will slow their rate of shrinkage, and that companies with growing free cash flow will see their growth rate slow, over this period. We do this to reflect that growth tends to slow more in the early years than it does in later years.
Generally we assume that a dollar today is more valuable than a dollar in the future, and so the sum of these future cash flows is then discounted to today's value:
10-year free cash flow (FCF) forecast
2024 | 2025 | 2026 | 2027 | 2028 | 2029 | 2030 | 2031 | 2032 | 2033 | |
Levered FCF ($, Millions) | US$21.0m | US$24.1m | US$18.2m | US$15.2m | US$13.5m | US$12.6m | US$12.0m | US$11.8m | US$11.7m | US$11.7m |
Growth Rate Estimate Source | Analyst x1 | Analyst x1 | Est @ -24.64% | Est @ -16.56% | Est @ -10.91% | Est @ -6.95% | Est @ -4.18% | Est @ -2.24% | Est @ -0.88% | Est @ 0.07% |
Present Value ($, Millions) Discounted @ 8.8% | US$19.3 | US$20.4 | US$14.1 | US$10.8 | US$8.9 | US$7.6 | US$6.7 | US$6.0 | US$5.5 | US$5.0 |
("Est" = FCF growth rate estimated by Simply Wall St)
Present Value of 10-year Cash Flow (PVCF) = US$104m
The second stage is also known as Terminal Value, this is the business's cash flow after the first stage. The Gordon Growth formula is used to calculate Terminal Value at a future annual growth rate equal to the 5-year average of the 10-year government bond yield of 2.3%. We discount the terminal cash flows to today's value at a cost of equity of 8.8%.
Terminal Value (TV)= FCF2033 × (1 + g) ÷ (r – g) = US$12m× (1 + 2.3%) ÷ (8.8%– 2.3%) = US$183m
Present Value of Terminal Value (PVTV)= TV / (1 + r)10= US$183m÷ ( 1 + 8.8%)10= US$79m
The total value is the sum of cash flows for the next ten years plus the discounted terminal value, which results in the Total Equity Value, which in this case is US$183m. The last step is to then divide the equity value by the number of shares outstanding. Relative to the current share price of US$13.8, the company appears slightly overvalued at the time of writing. Remember though, that this is just an approximate valuation, and like any complex formula - garbage in, garbage out.
Important Assumptions
The calculation above is very dependent on two assumptions. The first is the discount rate and the other is the cash flows. You don't have to agree with these inputs, I recommend redoing the calculations yourself and playing with them. The DCF also does not consider the possible cyclicality of an industry, or a company's future capital requirements, so it does not give a full picture of a company's potential performance. Given that we are looking at Superior Group of Companies as potential shareholders, the cost of equity is used as the discount rate, rather than the cost of capital (or weighted average cost of capital, WACC) which accounts for debt. In this calculation we've used 8.8%, which is based on a levered beta of 1.417. Beta is a measure of a stock's volatility, compared to the market as a whole. We get our beta from the industry average beta of globally comparable companies, with an imposed limit between 0.8 and 2.0, which is a reasonable range for a stable business.
SWOT Analysis for Superior Group of Companies
Strength
Debt is well covered by cash flow.
Weakness
Interest payments on debt are not well covered.
Dividend is low compared to the top 25% of dividend payers in the Luxury market.
Expensive based on P/E ratio and estimated fair value.
Opportunity
Annual earnings are forecast to grow faster than the American market.
Threat
Dividends are not covered by earnings.
Looking Ahead:
Valuation is only one side of the coin in terms of building your investment thesis, and it shouldn't be the only metric you look at when researching a company. It's not possible to obtain a foolproof valuation with a DCF model. Rather it should be seen as a guide to "what assumptions need to be true for this stock to be under/overvalued?" For instance, if the terminal value growth rate is adjusted slightly, it can dramatically alter the overall result. Can we work out why the company is trading at a premium to intrinsic value? For Superior Group of Companies, we've put together three pertinent aspects you should consider:
Risks: Every company has them, and we've spotted 3 warning signs for Superior Group of Companies (of which 1 is potentially serious!) you should know about.
Future Earnings: How does SGC's growth rate compare to its peers and the wider market? Dig deeper into the analyst consensus number for the upcoming years by interacting with our free analyst growth expectation chart.
Other High Quality Alternatives: Do you like a good all-rounder? Explore our interactive list of high quality stocks to get an idea of what else is out there you may be missing!
PS. The Simply Wall St app conducts a discounted cash flow valuation for every stock on the NASDAQGM every day. If you want to find the calculation for other stocks just search here.
Have feedback on this article? Concerned about the content? Get in touch with us directly. Alternatively, email editorial-team (at) simplywallst.com.
This article by Simply Wall St is general in nature. We provide commentary based on historical data and analyst forecasts only using an unbiased methodology and our articles are not intended to be financial advice. It does not constitute a recommendation to buy or sell any stock, and does not take account of your objectives, or your financial situation. We aim to bring you long-term focused analysis driven by fundamental data. Note that our analysis may not factor in the latest price-sensitive company announcements or qualitative material. Simply Wall St has no position in any stocks mentioned.
