Superior Plus (TSE:SPB) shareholders have earned a 0.7% CAGR over the last five years
For many, the main point of investing is to generate higher returns than the overall market. But even the best stock picker will only win with some selections. At this point some shareholders may be questioning their investment in Superior Plus Corp. (TSE:SPB), since the last five years saw the share price fall 24%. The falls have accelerated recently, with the share price down 12% in the last three months.
It's worthwhile assessing if the company's economics have been moving in lockstep with these underwhelming shareholder returns, or if there is some disparity between the two. So let's do just that.
View our latest analysis for Superior Plus
Given that Superior Plus didn't make a profit in the last twelve months, we'll focus on revenue growth to form a quick view of its business development. When a company doesn't make profits, we'd generally expect to see good revenue growth. That's because it's hard to be confident a company will be sustainable if revenue growth is negligible, and it never makes a profit.
Over five years, Superior Plus grew its revenue at 2.1% per year. That's far from impressive given all the money it is losing. Given the weak growth, the share price fall of 4% isn't particularly surprising. Investors should consider how bad the losses are, and whether the company can make it to profitability with ease. Shareholders will want the company to approach profitability if it can't grow revenue any faster.
You can see how earnings and revenue have changed over time in the image below (click on the chart to see the exact values).
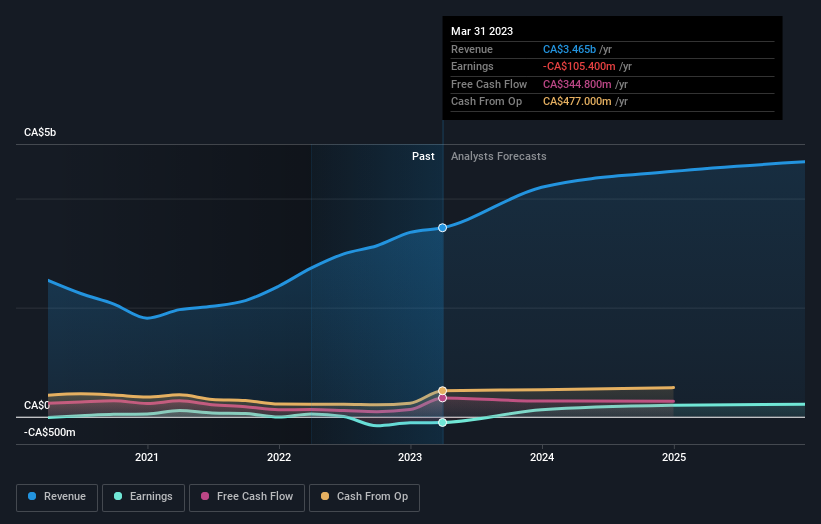
It's good to see that there was some significant insider buying in the last three months. That's a positive. On the other hand, we think the revenue and earnings trends are much more meaningful measures of the business. If you are thinking of buying or selling Superior Plus stock, you should check out this free report showing analyst profit forecasts.
What About Dividends?
It is important to consider the total shareholder return, as well as the share price return, for any given stock. Whereas the share price return only reflects the change in the share price, the TSR includes the value of dividends (assuming they were reinvested) and the benefit of any discounted capital raising or spin-off. Arguably, the TSR gives a more comprehensive picture of the return generated by a stock. We note that for Superior Plus the TSR over the last 5 years was 3.7%, which is better than the share price return mentioned above. And there's no prize for guessing that the dividend payments largely explain the divergence!
A Different Perspective
Investors in Superior Plus had a tough year, with a total loss of 10% (including dividends), against a market gain of about 8.4%. However, keep in mind that even the best stocks will sometimes underperform the market over a twelve month period. Longer term investors wouldn't be so upset, since they would have made 0.7%, each year, over five years. It could be that the recent sell-off is an opportunity, so it may be worth checking the fundamental data for signs of a long term growth trend. It's always interesting to track share price performance over the longer term. But to understand Superior Plus better, we need to consider many other factors. For example, we've discovered 3 warning signs for Superior Plus (1 is a bit concerning!) that you should be aware of before investing here.
If you like to buy stocks alongside management, then you might just love this free list of companies. (Hint: insiders have been buying them).
Please note, the market returns quoted in this article reflect the market weighted average returns of stocks that currently trade on Canadian exchanges.
Have feedback on this article? Concerned about the content? Get in touch with us directly. Alternatively, email editorial-team (at) simplywallst.com.
This article by Simply Wall St is general in nature. We provide commentary based on historical data and analyst forecasts only using an unbiased methodology and our articles are not intended to be financial advice. It does not constitute a recommendation to buy or sell any stock, and does not take account of your objectives, or your financial situation. We aim to bring you long-term focused analysis driven by fundamental data. Note that our analysis may not factor in the latest price-sensitive company announcements or qualitative material. Simply Wall St has no position in any stocks mentioned.
Join A Paid User Research Session
You’ll receive a US$30 Amazon Gift card for 1 hour of your time while helping us build better investing tools for the individual investors like yourself. Sign up here
