Synchrony (SYF) Q3 Earnings Beat on Growing Purchase Volume
Synchrony Financial SYF reported third-quarter 2023 adjusted earnings per share of $1.48, which beat the Zacks Consensus Estimate by 2.8%. The bottom line rose 0.7% year over year.
Net interest income improved 11% year over year to $4,362 million, beating the consensus mark by 1.6%.
SYF’s strong third-quarter results benefited on the back of higher interest earned, thanks to a high-interest rate environment, expanding average loan receivables and elevated benchmark rates. However, increased expenses and provision for credit losses partially offset the upside.
Synchrony Financial Price, Consensus and EPS Surprise
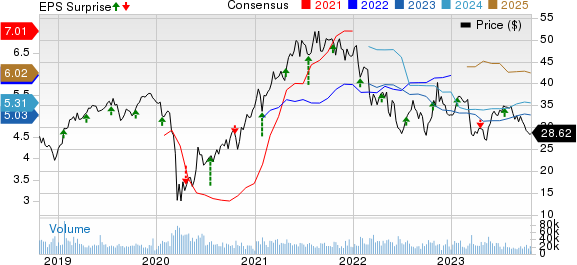
Synchrony Financial price-consensus-eps-surprise-chart | Synchrony Financial Quote
Q3 Results in Detail
Other income of Synchrony Financial amounted to $92 million, which surged 109.1% year over year in the third quarter and beat our estimate by more than one-fold due to higher interchange revenues and debt cancelation fees.
Total loan receivables of SYF grew 14% year over year to $97.9 billion but lagged behind our estimate of $98.1 billion in the quarter under review.
Total deposits came in at $78.1 billion, which rose 14% year over year. Provision for credit losses increased 60.2% year over year to $1,488 million due to increased net charge-offs and a reserve build.
The purchase volume of Synchrony Financial advanced 5% year over year to $47,006 million in the third quarter. However, the figure lagged our estimate by 5.2%.
Interest and fees on loans of $5,151 million improved 21% year over year, which outpaced our estimate by 3.2% on the back of a growing average loan receivables portfolio, increased benchmark rates and lower payment rates. Net interest margin deteriorated 16 basis points (bps) year over year to 15.36%.
New accounts of 5.7 million slipped 2% year over year. Average active accounts increased 6% year over year to 70.3 million in the third quarter.
Total other expenses of SYF amounted to $1,154 million, up 8.5% year over year but 0.1% lower than our estimate due to investments in technology and operational losses. The efficiency ratio of 33.2% improved 330 bps year over year in the quarter under review.
Individual Sales Platforms' Update
Home & Auto period-end loan receivables climbed 9.1% year over year to $31,648 million on the back of lower payment rates. Purchase volume of $12,273 million remained flat year over year in the third quarter. Interest and fees on loans grew 13% year over year to $1,367 million, beating our estimate of $1,315 million on the back of growth in loan receivables and increased benchmark rates.
Digital period-end loan receivables of $26,685 million rose 16.4% year over year in the quarter under review on lower payment rates and higher purchase volume. Purchase volume came in at $13,808 million, up 6.7% year over year on the back of growing average active accounts. Interest and fees on loans climbed 27.8% year over year to $1,530 million, beating our estimate by 4.8%, driven by growth in loan receivables, higher benchmark rates and maturing newer programs.
Diversified & Value period-end loan receivables grew 13.9% year over year to $18,865 million in the third quarter on higher purchase volume and decreased payment rates. Purchase volume of $15,445 million improved 6.9% year over year, attributable to solid out-of-partner spending, impressive retailer performance and penetration growth. Interest and fees on loans advanced 24.9% year over year to $1,168 million, beating our estimate by 5.3% on higher loan receivables and benchmark rates.
Health & Wellness period-end loan receivables of $14,019 million rose 21% year over year in the quarter under review on increased promotional purchase volume and reduction in payment rates. Purchase volume climbed 13.5% year over year to $3,990 million on the back of strong active accounts growth, mainly in Dental, Pet and Cosmetic. Interest and fees on loans improved 19.5% year over year to $844 million, which outpaced our estimate of $799.6 million on higher volume and loan receivables.
Lifestyle period-end loan receivables advanced 14% year over year to $6,483 million in the third quarter on growing purchase volume and reduced payment rates. Purchase volume of $1,490 million grew 8.4% year over year, thanks to higher transaction values in Outdoor and Luxury. Interest and fees on loans climbed 19.7% year over year to $249 million, which lagged our estimate by 18%.
Financial Position (as of Sep 30, 2023)
Synchrony Financial exited the third quarter with cash and equivalents of $15,643 million, which increased from $10,294 million at 2022-end.
Total assets of $112.9 billion rose from $104.6 billion at 2022-end. Total borrowings advanced to $15,231 million from $14,191 million at the end of 2022.
Total equity of $13,767 million increased from $12,873 million at the end of 2022.
SYF’s balance sheet was consistently strong in the reported quarter, with total liquidity of $20.5 billion accounting for 18.2% of its total assets.
Return on assets of 2.3% deteriorated 50 bps year over year in the third quarter, while return on equity contracted 300 bps year over year to 18.1% in the same time frame.
Capital Deployment
Synchrony Financial returned capital worth $254 million through share buybacks of $150 million and paid common stock dividends of $104 million in the third quarter. It had a leftover share buyback capacity of $850 million at the end of September 2023.
2023 Guidance
The company continues to expect loan receivables growth to be around 11% for this year. In 2022, loan receivables registered 14.5% year-over-year growth. The company anticipates payment rate moderation to continue but stay above the pre-pandemic levels.
Net interest margin is now anticipated to be around 15.15%, indicating a deterioration from the 2022 reported figure of 15.63%. The company expects the metric to remain consistent with the first-half levels. It expects interest and fees to grow going ahead.
Net charge-offs are now projected to be around 4.85%, which indicates an increase from the 2022 reported figure of 3.00%. The company expects net charge-offs to keep increasing but not reach pre-pandemic levels before 2024.
Management expects quarterly operating expenses of $1,150 million for 2023.
Even though the continuous high-interest rate environment is helping companies like SYF earn higher interest income, it will likely affect consumers’ spending levels. Losses are expected to build up on cards as well as office real estate.
Zacks Rank & Other Key Picks
Synchrony Financial currently has a Zacks Rank #2 (Buy).
Investors interested in the broader finance space can also check other top-ranked companies like Axos Financial, Inc. AX, StoneX Group Inc. SNEX and Globe Life Inc. GL. Axos Financial and StoneX sport a Zacks Rank #1 (Strong Buy), while Globe Life carries a Zacks Rank #2. You can see the complete list of today’s Zacks #1 Rank stocks here.
The bottom line of Axos Financial outpaced estimates in each of the last four quarters, the average surprise being 11.6%. The Zacks Consensus Estimate for AX’s 2023 earnings and revenues suggests an improvement of 6.9% and 8.6%, respectively, from the year-ago reported figures.
StoneX’s earnings outpaced estimates in three of the trailing four quarters, missing once, the average surprise being 19.7%. The Zacks Consensus Estimate for SNEX’s fiscal 2023 earnings and revenues suggests an improvement of 10.6% and 43.8%, respectively, from the year-ago reported figures.
The bottom line of Globe Life outpaced estimates in each of the last four quarters, the average surprise being 2.2%. The Zacks Consensus Estimate for GL’s 2023 earnings and revenues suggests an improvement of 28.7% and 4.1%, respectively, from the year-ago reported figures.
Want the latest recommendations from Zacks Investment Research? Today, you can download 7 Best Stocks for the Next 30 Days. Click to get this free report
Synchrony Financial (SYF) : Free Stock Analysis Report
AXOS FINANCIAL, INC (AX) : Free Stock Analysis Report
Globe Life Inc. (GL) : Free Stock Analysis Report
StoneX Group Inc. (SNEX) : Free Stock Analysis Report
