Synchrony (SYF) Q4 Earnings Beat on Robust Receivables Growth
Synchrony Financial SYF reported fourth-quarter 2023 adjusted earnings per share (EPS) of $1.03, which beat the Zacks Consensus Estimate by 7.3%. However, the bottom line declined 18.3% year over year.
Net interest income improved 8% year over year to $4,466 million, beating the consensus mark by 0.3%.
SYF reported better-than-expected quarterly results benefiting from higher interest earned, thanks to a high-interest rate environment, expanding average loan receivables and elevated benchmark rates. However, increased expenses and provision for credit losses partially offset the upside.
Synchrony Financial Price, Consensus and EPS Surprise
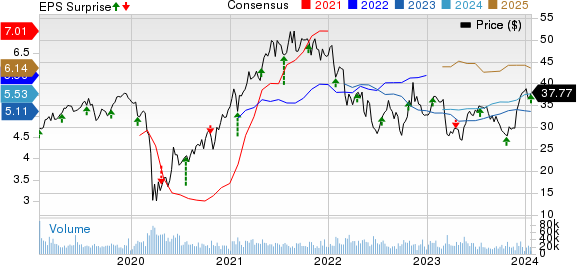
Synchrony Financial price-consensus-eps-surprise-chart | Synchrony Financial Quote
Q4 Results in Detail
Other income of Synchrony amounted to $71 million, which surged 136.7% year over year in the fourth quarter and beat our estimate by more than one-fold due to higher interchange revenues and protection product revenues.
Total loan receivables of SYF grew 11.4% year over year to $103 billion and surpassed our estimate of $102.7 billion in the quarter under review.
Total deposits were $81.2 billion, which rose 13.1% year over year. Provision for credit losses increased 50.2% year over year to $1,804 million due to increased net charge-offs.
The purchase volume of Synchrony advanced 3% year over year to $49,339 million in the fourth quarter. However, the figure lagged our estimate by 3.9%.
Interest and fees on loans of $5,323 million improved 16.3% year over year, which outpaced our estimate by 1.1% on the back of a growing average loan receivables portfolio, increased benchmark rates and lower payment rates. Net interest margin deteriorated 48 basis points (bps) year over year to 15.10%.
New accounts of 6.2 million slipped 3% year over year. Average active accounts increased 5% year over year to 71.5 million in the fourth quarter.
Total other expenses of SYF amounted to $1,316 million, up 14.3% year over year and surpassing our estimate by 14.2%. The efficiency ratio of 36% deteriorated 120 bps year over year in the quarter under review.
Individual Sales Platforms' Update
Home & Auto period-end loan receivables climbed 6.6% year over year to $31,969 million on the back of lower payment rates. However, the purchase volume of $11,421 million declined 3.7% year over year in the fourth quarter. Interest and fees on loans grew 11% year over year to $1,403 million, beating our estimate of $1,367.9 million on the back of growth in loan receivables and increased benchmark rates.
Digital period-end loan receivables of $28,925 million rose 13.3% year over year in the quarter under review on lower payment rates and higher purchase volume. Purchase volume was $15,510 million, up 4.8% year over year on the back of growing average active accounts and better customer engagement. Interest and fees on loans climbed 19.4% year over year to $1,579 million, beating our estimate by 4.8%, driven by growth in loan receivables, higher benchmark rates, maturing newer programs and lower payment rates.
Diversified & Value period-end loan receivables grew 11% year over year to $20,666 million in the fourth quarter on higher purchase volume and decreased payment rates. Purchase volume of $16,987 million improved 4.4% year over year, attributable to solid in and out of partner spending. Interest and fees on loans advanced 17.7% year over year to $1,204 million, beating our estimate by 5.3% on higher loan receivables and benchmark rates.
Health & Wellness period-end loan receivables of $14,521 million rose 19.2% year over year in the quarter under review on increased promotional purchase volume and reduction in payment rates. Purchase volume climbed 10.4% year over year to $3,870 million on the back of strong active accounts growth, mainly in Dental, Pet and Cosmetic. Interest and fees on loans improved 16.4% year over year to $866 million, which outpaced our estimate of $799.6 million on higher volume and loan receivables.
Lifestyle period-end loan receivables advanced 13% year over year to $6,744 million in the fourth quarter on growing purchase volume and reduced payment rates. Purchase volume of $1,550 million grew 3.5% year over year, thanks to higher transaction values in Outdoor and Luxury. Interest and fees on loans climbed 15.4% year over year to $255 million, which lagged our estimate by 8.5%.
Financial Position (as of Dec 31, 2023)
Synchrony exited the fourth quarter with cash and equivalents of $14,259 million, which increased from $10,294 million at 2022-end.
Total assets of $117.5 billion rose from $104.6 billion at 2022-end. Total borrowings advanced to $15,982 million from $14,191 million at the end of 2022.
Total equity of $13,903 million increased from $12,873 million at the end of 2022.
SYF’s balance sheet was consistently strong in the reported quarter, with total liquidity of $19.8 billion accounting for 16.8% of its total assets.
Return on assets of 1.5% deteriorated 70 bps year over year in the fourth quarter, while return on equity contracted 510 bps year over year to 12.4% in the same time frame.
Capital Deployment
Synchrony returned capital worth $1.1 billion through share buybacks and paid common stock dividends of $406 million in 2023. It had a leftover share buyback capacity of $600 million at the end of December 2023.
Full-Year Update
In 2023, Synchrony’s adjusted earnings per share of $5.18 tumbled 15.8% from the 2022 figure. The net interest income of SYF grew 8.8% year over year to $16,999 million. Purchase volume of $185.2 billion improved 2.8% year over year.
2024 Guidance
The company expects loan receivables growth to be around 6-8% for 2024. In 2023, loan receivables registered 11% year-over-year growth. The company anticipates payment rate moderation to continue but stay above the pre-pandemic levels.
Net interest income is now anticipated to be around $17.5-18.5 billion, indicating an improvement from the previous year’s figure of $17 billion.
Net charge-offs are projected to be around 5.75-6%, which indicates an increase from the 2023 reported figure of 4.87%. The company expects net charge-offs to be at the highest during the first half and then reach pre-pandemic levels for the remainder of 2024.
Management expects RSA/Average Loan Receivables to range between 3.5% and 3.75% in 2024, reflecting normalization in credit, high interest expense and portfolio mix being offset by improved purchase volume.
Management expects an efficiency ratio in the range of 32.5-33.5% for 2024.
Zacks Rank & Key Picks
Synchrony currently has a Zacks Rank #3 (Hold).
Some better-ranked stocks in the broader Finance space are Alerus Financial Corporation ALRS, Navient Corporation NAVI and Finward Bancorp FNWD. Each stock currently sports a Zacks Rank #1 (Strong Buy). You can see the complete list of today’s Zacks #1 Rank stocks here.
The consensus mark for Alerus Financial’s 2023 earnings is pegged at $1.60 per share, which remained stable over the past week. ALRS beat earnings estimates in three of the past four quarters and missed once, with an average surprise of 16.6%.
The Zacks Consensus Estimate for Navient’s 2023 earnings is pegged at $3.49 per share, indicating a 9.4% year-over-year increase. It has witnessed one upward estimate revision against none in the opposite direction during the past month. The consensus mark for NAVI’s revenues in 2023 is pegged at $964.7 million.
The Zacks Consensus Estimate for Finward’s 2023 earnings is pegged at $2.07 per share, which has improved 63% in the past 60 days. FNWD has witnessed one upward estimate revision against none in the opposite direction during this time.
Want the latest recommendations from Zacks Investment Research? Today, you can download 7 Best Stocks for the Next 30 Days. Click to get this free report
Navient Corporation (NAVI) : Free Stock Analysis Report
Synchrony Financial (SYF) : Free Stock Analysis Report
Alerus Financial (ALRS) : Free Stock Analysis Report
Finward Bancorp (FNWD) : Free Stock Analysis Report
