What Is TAKKT's (ETR:TTK) P/E Ratio After Its Share Price Tanked?

Unfortunately for some shareholders, the TAKKT (ETR:TTK) share price has dived 52% in the last thirty days. Indeed the recent decline has arguably caused some bitterness for shareholders who have held through the 58% drop over twelve months.
All else being equal, a share price drop should make a stock more attractive to potential investors. While the market sentiment towards a stock is very changeable, in the long run, the share price will tend to move in the same direction as earnings per share. The implication here is that long term investors have an opportunity when expectations of a company are too low. One way to gauge market expectations of a stock is to look at its Price to Earnings Ratio (PE Ratio). Investors have optimistic expectations of companies with higher P/E ratios, compared to companies with lower P/E ratios.
See our latest analysis for TAKKT
Does TAKKT Have A Relatively High Or Low P/E For Its Industry?
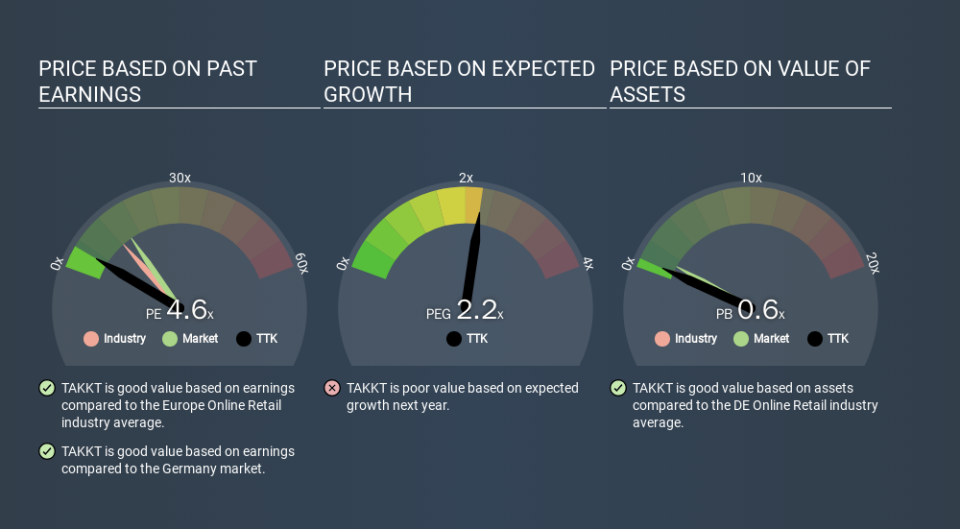
We can tell from its P/E ratio of 4.60 that sentiment around TAKKT isn't particularly high. If you look at the image below, you can see TAKKT has a lower P/E than the average (12.3) in the online retail industry classification.
This suggests that market participants think TAKKT will underperform other companies in its industry. Since the market seems unimpressed with TAKKT, it's quite possible it could surprise on the upside. If you consider the stock interesting, further research is recommended. For example, I often monitor director buying and selling.
How Growth Rates Impact P/E Ratios
Companies that shrink earnings per share quickly will rapidly decrease the 'E' in the equation. That means even if the current P/E is low, it will increase over time if the share price stays flat. So while a stock may look cheap based on past earnings, it could be expensive based on future earnings.
TAKKT shrunk earnings per share by 11% over the last year. But it has grown its earnings per share by 9.3% per year over the last five years. And it has shrunk its earnings per share by 3.1% per year over the last three years. This might lead to low expectations.
Remember: P/E Ratios Don't Consider The Balance Sheet
The 'Price' in P/E reflects the market capitalization of the company. Thus, the metric does not reflect cash or debt held by the company. The exact same company would hypothetically deserve a higher P/E ratio if it had a strong balance sheet, than if it had a weak one with lots of debt, because a cashed up company can spend on growth.
Such spending might be good or bad, overall, but the key point here is that you need to look at debt to understand the P/E ratio in context.
So What Does TAKKT's Balance Sheet Tell Us?
TAKKT has net debt equal to 33% of its market cap. While it's worth keeping this in mind, it isn't a worry.
The Verdict On TAKKT's P/E Ratio
TAKKT's P/E is 4.6 which is below average (15.5) in the DE market. With only modest debt, it's likely the lack of EPS growth at least partially explains the pessimism implied by the P/E ratio. Given TAKKT's P/E ratio has declined from 9.5 to 4.6 in the last month, we know for sure that the market is more worried about the business today, than it was back then. For those who prefer invest in growth, this stock apparently offers limited promise, but the deep value investors may find the pessimism around this stock enticing.
When the market is wrong about a stock, it gives savvy investors an opportunity. If it is underestimating a company, investors can make money by buying and holding the shares until the market corrects itself. So this free report on the analyst consensus forecasts could help you make a master move on this stock.
Of course, you might find a fantastic investment by looking at a few good candidates. So take a peek at this free list of companies with modest (or no) debt, trading on a P/E below 20.
If you spot an error that warrants correction, please contact the editor at editorial-team@simplywallst.com. This article by Simply Wall St is general in nature. It does not constitute a recommendation to buy or sell any stock, and does not take account of your objectives, or your financial situation. Simply Wall St has no position in the stocks mentioned.
We aim to bring you long-term focused research analysis driven by fundamental data. Note that our analysis may not factor in the latest price-sensitive company announcements or qualitative material. Thank you for reading.
