Is Talanx AG's (ETR:TLX) Recent Stock Performance Tethered To Its Strong Fundamentals?
Most readers would already be aware that Talanx's (ETR:TLX) stock increased significantly by 11% over the past month. Given the company's impressive performance, we decided to study its financial indicators more closely as a company's financial health over the long-term usually dictates market outcomes. Particularly, we will be paying attention to Talanx's ROE today.
ROE or return on equity is a useful tool to assess how effectively a company can generate returns on the investment it received from its shareholders. Put another way, it reveals the company's success at turning shareholder investments into profits.
Check out our latest analysis for Talanx
How To Calculate Return On Equity?
Return on equity can be calculated by using the formula:
Return on Equity = Net Profit (from continuing operations) ÷ Shareholders' Equity
So, based on the above formula, the ROE for Talanx is:
18% = €2.8b ÷ €16b (Based on the trailing twelve months to September 2023).
The 'return' is the yearly profit. One way to conceptualize this is that for each €1 of shareholders' capital it has, the company made €0.18 in profit.
What Has ROE Got To Do With Earnings Growth?
Thus far, we have learned that ROE measures how efficiently a company is generating its profits. Depending on how much of these profits the company reinvests or "retains", and how effectively it does so, we are then able to assess a company’s earnings growth potential. Assuming all else is equal, companies that have both a higher return on equity and higher profit retention are usually the ones that have a higher growth rate when compared to companies that don't have the same features.
A Side By Side comparison of Talanx's Earnings Growth And 18% ROE
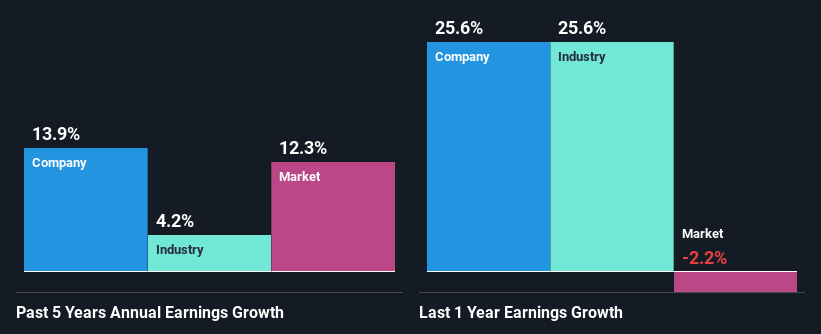
To begin with, Talanx seems to have a respectable ROE. Especially when compared to the industry average of 10% the company's ROE looks pretty impressive. This certainly adds some context to Talanx's decent 14% net income growth seen over the past five years.
We then compared Talanx's net income growth with the industry and we're pleased to see that the company's growth figure is higher when compared with the industry which has a growth rate of 4.2% in the same 5-year period.
Earnings growth is an important metric to consider when valuing a stock. It’s important for an investor to know whether the market has priced in the company's expected earnings growth (or decline). By doing so, they will have an idea if the stock is headed into clear blue waters or if swampy waters await. If you're wondering about Talanx's's valuation, check out this gauge of its price-to-earnings ratio, as compared to its industry.
Is Talanx Using Its Retained Earnings Effectively?
Talanx has a three-year median payout ratio of 42%, which implies that it retains the remaining 58% of its profits. This suggests that its dividend is well covered, and given the decent growth seen by the company, it looks like management is reinvesting its earnings efficiently.
Besides, Talanx has been paying dividends for at least ten years or more. This shows that the company is committed to sharing profits with its shareholders. Upon studying the latest analysts' consensus data, we found that the company is expected to keep paying out approximately 37% of its profits over the next three years. Therefore, the company's future ROE is also not expected to change by much with analysts predicting an ROE of 14%.
Conclusion
Overall, we are quite pleased with Talanx's performance. Specifically, we like that the company is reinvesting a huge chunk of its profits at a high rate of return. This of course has caused the company to see substantial growth in its earnings. With that said, the latest industry analyst forecasts reveal that the company's earnings growth is expected to slow down. To know more about the company's future earnings growth forecasts take a look at this free report on analyst forecasts for the company to find out more.
Have feedback on this article? Concerned about the content? Get in touch with us directly. Alternatively, email editorial-team (at) simplywallst.com.
This article by Simply Wall St is general in nature. We provide commentary based on historical data and analyst forecasts only using an unbiased methodology and our articles are not intended to be financial advice. It does not constitute a recommendation to buy or sell any stock, and does not take account of your objectives, or your financial situation. We aim to bring you long-term focused analysis driven by fundamental data. Note that our analysis may not factor in the latest price-sensitive company announcements or qualitative material. Simply Wall St has no position in any stocks mentioned.
