TD SYNNEX (SNX) Q3 Earnings Top Estimates, Revenues Miss

TD SYNNEX SNX reported mixed results for the third quarter of fiscal 2023, wherein the bottom line surpassed the Zacks Consensus Estimate, while the top line missed the same. The company reported third-quarter non-GAAP earnings of $2.78 per share, which topped the Zacks Consensus Estimate of $2.50 per share and increased 1.5% year over year.
A greater mix of higher-margin high-growth portfolio mainly drove the bottom line, partially offset by lower revenues and a $16 million headwind from higher interest expenses.
Revenues of $13.96 billion decreased 9.1% year over year and missed the consensus mark of $14.04 billion. On a constant-currency basis, second-quarter revenues decreased 10.2%.
The year-over-year decline in the top line was mainly due to the weak demand for the company’s Endpoint Solutions amid softness in PC demand post-pandemic. This was partially offset by increased sales across the Advanced Solutions portfolio and high-growth technologies, with demand driven by cloud, security and data analytics-related technologies.
Region-wise, although TD SYNNEX continues to witness strong demand for its technology products and services across the Asia-Pacific and Japan region (10.3% year-over-year growth), the remaining two regions, the Americas and Europe, witnessed a year-over-year decline of 10.3% and 9.7%, respectively.
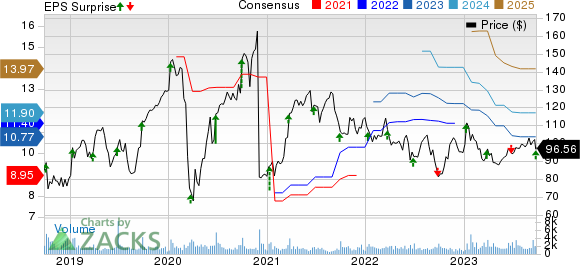
TD SYNNEX Corp. Price, Consensus and EPS Surprise
TD SYNNEX Corp. price-consensus-eps-surprise-chart | TD SYNNEX Corp. Quote
Quarterly Details
The non-GAAP gross profit increased 3.4% year over year to $973.7 million. Meanwhile, the non-GAAP gross margin improved 84 basis points (bps) to 6.97%, mainly driven by a greater mix of the higher-margin high-growth portfolio.
In the reported quarter, the non-GAAP operating income was down 0.4% to $396.8 million, mainly due to higher SG&A expenses, which more than offset the benefits of the increased gross margin. Adjusted SG&A expenses increased to $576.9 million from the year-ago quarter’s $543.7 million.
The non-GAAP operating margin improved by 25 bps on a year-over-year basis to 2.84%, primarily driven by the higher gross margin, partially offset by increased SG&A expenses as a percentage of revenues. SG&A expenses as a percentage of revenues increased to 4.1% from 3.5% in the year-ago quarter.
TD SYNNEX ended the fiscal third quarter with cash and cash equivalents of $1.25 billion compared with $852.1 million witnessed at the end of the fiscal second quarter. During the reported quarter, SNX generated operating cash flow and free cash flow of $592 million and $552 million, respectively. In the first three quarters of fiscal 2023, the company generated operating and free cash flows of $1.2 billion and $1.09 billion, respectively.
TD SYNNEX returned $133 million to shareholders in the third quarter by repurchasing stocks worth $103 million and paying out $33 million in dividends. In the first nine months of the fiscal, the company returned $374 million to shareholders by repurchasing stocks worth $278 million and paying out $99 million in dividends.
SNX announced a quarterly cash dividend of 35 cents per share, payable on Oct 27, 2023, to the shareholders of record on Oct 13, 2023.
Guidance
TD SYNNEX issued dismal guidance for the fourth quarter of fiscal 2023. It expects to generate revenues between $14 billion and $15 billion for the fourth quarter. The Zacks Consensus Estimate for fourth-quarter revenues is pegged at $15.12 billion.
The non-GAAP net income is estimated in the range of $223-$269 million. Moreover, TD SYNNEX projects non-GAAP earnings between $2.40 and $2.90 per share for the fourth quarter. The consensus mark for fourth-quarter non-GAAP earnings stands at $2.97 per share.
Zacks Rank & Stocks to Consider
TD SYNNEX currently carries a Zacks Rank #3 (Hold). Shares of the company have increased 2% year to date (YTD).
Some better-ranked stocks from the broader technology sector are NVIDIA NVDA, Paylocity Holding PCTY and Palo Alto Networks PANW. NVIDIA and Paylocity each sport a Zacks Rank #1 (Strong Buy), while Palo Alto Networks carries a Zacks Rank #2 (Buy). You can see the complete list of today's Zacks #1 Rank stocks here.
The Zacks Consensus Estimate for NVIDIA's third-quarter fiscal 2024 earnings has been revised upward by 8 cents to $3.32 per share in the past 30 days. For fiscal 2024, earnings estimates have increased by 21 cents to $10.67 per share in the past 30 days.
NVIDIA’s earnings beat the Zacks Consensus Estimate thrice in the preceding four quarters while missing on one occasion, the average surprise being 9.8%. Shares of NVDA have surged 186.9% YTD.
The Zacks Consensus Estimate for Paylocity’s first-quarter fiscal 2024 earnings has remained unchanged at $1.07 per share in the past 60 days. For fiscal 2024, earnings estimates have moved 31 cents upward to $5.58 per share in the past 60 days.
Paylocity’s earnings beat the Zacks Consensus Estimate in the preceding four quarters, the average surprise being 39.7%. Shares of PCTY have declined 8.7% YTD.
The Zacks Consensus Estimate for Palo Alto Networks' first-quarter fiscal 2024 earnings has been revised upward by a penny to $1.16 per share in the past 30 days. For fiscal 2024, earnings estimates have increased by 4 cents to $5.34 per share in the past 30 days.
Palo Alto Networks’ earnings beat the Zacks Consensus Estimate in the preceding four quarters, the average surprise being 22.2%. Shares of PANW have surged 62.6% YTD.
Want the latest recommendations from Zacks Investment Research? Today, you can download 7 Best Stocks for the Next 30 Days. Click to get this free report
NVIDIA Corporation (NVDA) : Free Stock Analysis Report
TD SYNNEX Corp. (SNX) : Free Stock Analysis Report
Palo Alto Networks, Inc. (PANW) : Free Stock Analysis Report
Paylocity Holding Corporation (PCTY) : Free Stock Analysis Report
