TechnipFMC (FTI) Q2 Earnings Disappoint, Revenues Beat
TechnipFMC plc FTI reported second-quarter 2023 adjusted earnings of 10 cents per share, which lagged the Zacks Consensus Estimate of 16 cents. This underperformance can be attributed to year-over-year higher costs and expenses. However, the bottom line improved from the year-ago quarter’s reported profit of 2 cents per share. The improvement can be attributed to better-than-expected performance in the Subsea and Surface Technologies segments.
Revenues of $1.97 billion beat the Zacks Consensus Estimate by 2.1%. The top line also increased from the year-ago quarter’s reported figure of $1.72 billion. This was primarily due to a higher revenue contribution from the aforementioned segments.
FTI’s second-quarter inbound orders improved 102.3% year over year to almost $4.45 billion. This indicates strong revenue potential.
As of June-end, the order backlog was $13.28 billion, implying an improvement of almost 46.9% from the prior-year quarter’s number.
TechnipFMC plc Price, Consensus and EPS Surprise
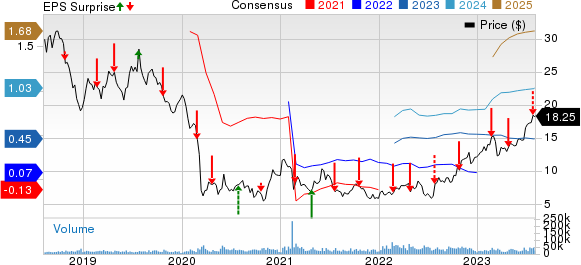
TechnipFMC plc price-consensus-eps-surprise-chart | TechnipFMC plc Quote
Segmental Analysis
Subsea: Revenues in this segment totaled $1.62 billion, up 14.9% from the year-ago quarter’s recorded figure of $1.41 billion. The figure also beat our projection of $1.54 billion. This was primarily due to an increase in project activities in South America, the North Sea and the Gulf of Mexico.
Adjusted EBITDA was $233.8 million, up about 32.8% from the year-ago quarter’s level and beat our estimate of $195.6 million. Inbound orders increased 113% to $4.11 billion. The backlog rose 52.5%.
Surface Technologies: This segment recorded revenues of $353.8 million, up 16.9% year over year. The figure also beat our projection of $325.4 million. This was primarily due to growth in the Middle East and North America that benefited from the continued increase in drilling and completion activities.
The unit’s adjusted EBITDA increased 44.8% to $46.9 million. The figure beat our estimate of $40.9 million. The segment’s inbound orders rose 21.6%. The quarter-end backlog increased 6.9%.
Financials
TechnipFMC reported $1.81 million in costs and expenses, up 10.4% from the year-ago quarter’s recorded figure of $1.64 million.
During the reported quarter, the company spent $52.8 million on capital programs. As of Jun 30, it had cash and cash equivalents worth $585.2 million and long-term debt of $844 million, with a debt-to-capitalization of 21.2%.
Outlook
TechnipFMC retained its revenue expectations from the Subsea unit in the $5.9-$6.3 billion range. It also maintained its revenue guidance for the Surface Technologies unit between $1.3 billion and $1.45 billion. The adjusted EBITDA margin is anticipated in the 12.5-13.5% range for the Subsea segment, and the same for the Surface Technologies segment is projected between 12% and 14%.
The company reiterated its free cash flow generation guidance in the band of $225-$375 million. It also maintained its annual capital expenditure projection of $250 million and net interest expense guidance of $100-$110 million. TechnipFMC anticipates net corporate expenses to be in the range of $100-$110 million and tax provisions in the band of $155-$165 million.
Zacks Rank and Key Picks
Currently, FTIcarries a Zacks Rank #3 (Hold).
Some better-ranked stocks for investors interested in the energy sector are Evolution Petroleum EPM, sporting a Zacks Rank #1 (Strong Buy), and Murphy USA MUSA and NGL Energy Partners NGL, both carrying a Zacks Rank #2 (Buy) at present. You can see the complete list of today’s Zacks #1 Rank stocks here.
Evolution Petroleum is worth approximately $307.07 million. EPM currently pays a dividend of 48 cents per share, or 5.20% on an annual basis.
The company currently has a forward P/E ratio of 8.55. In comparison, its industry has an average forward P/E of 13.40, which means EPM is trading at a discount to the group.
Murphy USA is valued at around $6.58 billion. In the past year, its shares have risen 5.8%
MUSA currently pays a dividend of $1.52 per share, or 0.50% on an annual basis. Its payout ratio currently sits at 6% of earnings.
NGL Energy Partners is valued at around $535.63 million. In the past year, its units have risen 149.1%.
The partnership currently has a forward P/E ratio of 4.67. In comparison, its industry has an average forward P/E of 16.20, which means NGL is trading at a discount to the group.
Want the latest recommendations from Zacks Investment Research? Today, you can download 7 Best Stocks for the Next 30 Days. Click to get this free report
TechnipFMC plc (FTI) : Free Stock Analysis Report
Murphy USA Inc. (MUSA) : Free Stock Analysis Report
NGL Energy Partners LP (NGL) : Free Stock Analysis Report
Evolution Petroleum Corporation, Inc. (EPM) : Free Stock Analysis Report
