Should TechnipFMC plc (NYSE:FTI) Be Part Of Your Income Portfolio?

Is TechnipFMC plc (NYSE:FTI) a good dividend stock? How can we tell? Dividend paying companies with growing earnings can be highly rewarding in the long term. On the other hand, investors have been known to buy a stock because of its yield, and then lose money if the company's dividend doesn't live up to expectations.
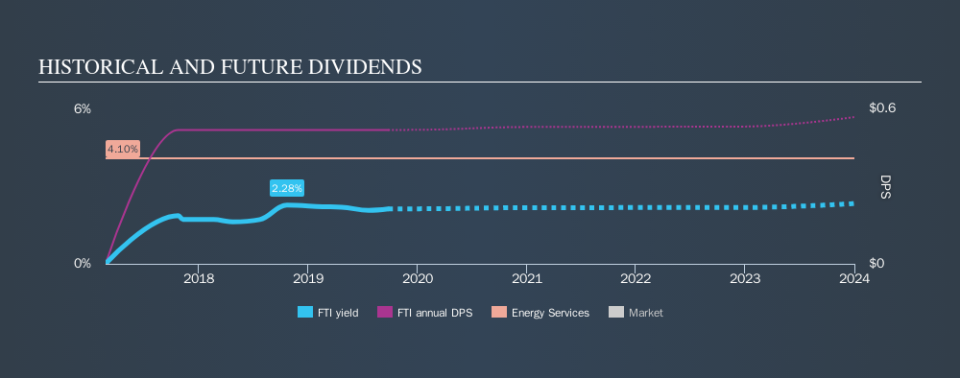
With only a two-year payment history, and a 2.1% yield, investors probably think TechnipFMC is not much of a dividend stock. While it may not look like much, if earnings are growing it could become quite interesting. The company also returned around 2.8% of its market capitalisation to shareholders in the form of stock buybacks over the past year. Some simple analysis can reduce the risk of holding TechnipFMC for its dividend, and we'll focus on the most important aspects below.
Explore this interactive chart for our latest analysis on TechnipFMC!
Payout ratios
Companies (usually) pay dividends out of their earnings. If a company is paying more than it earns, the dividend might have to be cut. As a result, we should always investigate whether a company can afford its dividend, measured as a percentage of a company's net income after tax. While TechnipFMC pays a dividend, it reported a loss over the last year. When a company is loss-making, we next need to check to see if its cash flows can support the dividend.
Last year, TechnipFMC paid a dividend while reporting negative free cash flow. While there may be an explanation, we think this behaviour is generally not sustainable.
With a strong net cash balance, TechnipFMC investors may not have much to worry about in the near term from a dividend perspective.
Remember, you can always get a snapshot of TechnipFMC's latest financial position, by checking our visualisation of its financial health.
Dividend Volatility
Before buying a stock for its income, we want to see if the dividends have been stable in the past, and if the company has a track record of maintaining its dividend. The company has been paying a stable dividend for a few years now, but we'd like to see more evidence of consistency over a longer period. During the past two-year period, the first annual payment was US$0.52 in 2017, compared to US$0.52 last year.
Modest dividend growth is good to see, especially with the payments being relatively stable. However, the payment history is relatively short and we wouldn't want to rely on this dividend too much.
Dividend Growth Potential
While dividend payments have been relatively reliable, it would also be nice if earnings per share (EPS) were growing, as this is essential to maintaining the dividend's purchasing power over the long term. TechnipFMC's EPS have fallen by approximately 63% per year. A sharp decline in earnings per share is not great from from a dividend perspective, as even conservative payout ratios can come under pressure if earnings fall far enough.
Conclusion
To summarise, shareholders should always check that TechnipFMC's dividends are affordable, that its dividend payments are relatively stable, and that it has decent prospects for growing its earnings and dividend. It's a concern to see that the company paid a dividend despite reporting a loss, and the dividend was also not well covered by free cash flow. Second, earnings per share have been in decline, and the dividend history is shorter than we'd like. In this analysis, TechnipFMC doesn't shape up too well as a dividend stock. We'd find it hard to look past the flaws, and would not be inclined to think of it as a reliable dividend-payer.
Without at least some growth in earnings per share over time, the dividend will eventually come under pressure either from costs or inflation. Very few businesses see earnings consistently shrink year after year in perpetuity though, and so it might be worth seeing what the 34 analysts we track are forecasting for the future.
We have also put together a list of global stocks with a market capitalisation above $1bn and yielding more 3%.
We aim to bring you long-term focused research analysis driven by fundamental data. Note that our analysis may not factor in the latest price-sensitive company announcements or qualitative material.
If you spot an error that warrants correction, please contact the editor at editorial-team@simplywallst.com. This article by Simply Wall St is general in nature. It does not constitute a recommendation to buy or sell any stock, and does not take account of your objectives, or your financial situation. Simply Wall St has no position in the stocks mentioned. Thank you for reading.
