Tecsys Inc.'s (TSE:TCS) Stock On An Uptrend: Could Fundamentals Be Driving The Momentum?
Tecsys' (TSE:TCS) stock is up by a considerable 21% over the past three months. As most would know, fundamentals are what usually guide market price movements over the long-term, so we decided to look at the company's key financial indicators today to determine if they have any role to play in the recent price movement. Specifically, we decided to study Tecsys' ROE in this article.
ROE or return on equity is a useful tool to assess how effectively a company can generate returns on the investment it received from its shareholders. In simpler terms, it measures the profitability of a company in relation to shareholder's equity.
Check out our latest analysis for Tecsys
How Do You Calculate Return On Equity?
ROE can be calculated by using the formula:
Return on Equity = Net Profit (from continuing operations) ÷ Shareholders' Equity
So, based on the above formula, the ROE for Tecsys is:
4.3% = CA$3.2m ÷ CA$75m (Based on the trailing twelve months to July 2023).
The 'return' is the yearly profit. Another way to think of that is that for every CA$1 worth of equity, the company was able to earn CA$0.04 in profit.
What Is The Relationship Between ROE And Earnings Growth?
We have already established that ROE serves as an efficient profit-generating gauge for a company's future earnings. We now need to evaluate how much profit the company reinvests or "retains" for future growth which then gives us an idea about the growth potential of the company. Generally speaking, other things being equal, firms with a high return on equity and profit retention, have a higher growth rate than firms that don’t share these attributes.
Tecsys' Earnings Growth And 4.3% ROE
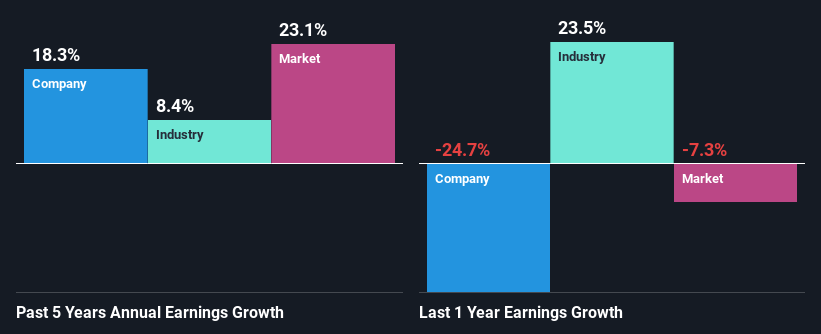
When you first look at it, Tecsys' ROE doesn't look that attractive. We then compared the company's ROE to the broader industry and were disappointed to see that the ROE is lower than the industry average of 17%. However, the moderate 18% net income growth seen by Tecsys over the past five years is definitely a positive. So, there might be other aspects that are positively influencing the company's earnings growth. For example, it is possible that the company's management has made some good strategic decisions, or that the company has a low payout ratio.
We then compared Tecsys' net income growth with the industry and we're pleased to see that the company's growth figure is higher when compared with the industry which has a growth rate of 8.4% in the same 5-year period.
The basis for attaching value to a company is, to a great extent, tied to its earnings growth. What investors need to determine next is if the expected earnings growth, or the lack of it, is already built into the share price. Doing so will help them establish if the stock's future looks promising or ominous. Is TCS fairly valued? This infographic on the company's intrinsic value has everything you need to know.
Is Tecsys Efficiently Re-investing Its Profits?
Tecsys has a significant three-year median payout ratio of 88%, meaning that it is left with only 12% to reinvest into its business. This implies that the company has been able to achieve decent earnings growth despite returning most of its profits to shareholders.
Additionally, Tecsys has paid dividends over a period of at least ten years which means that the company is pretty serious about sharing its profits with shareholders.
Conclusion
On the whole, we do feel that Tecsys has some positive attributes. Namely, its high earnings growth. We do however feel that the earnings growth number could have been even higher, had the company been reinvesting more of its earnings and paid out less dividends. Up till now, we've only made a short study of the company's growth data. To gain further insights into Tecsys' past profit growth, check out this visualization of past earnings, revenue and cash flows.
Have feedback on this article? Concerned about the content? Get in touch with us directly. Alternatively, email editorial-team (at) simplywallst.com.
This article by Simply Wall St is general in nature. We provide commentary based on historical data and analyst forecasts only using an unbiased methodology and our articles are not intended to be financial advice. It does not constitute a recommendation to buy or sell any stock, and does not take account of your objectives, or your financial situation. We aim to bring you long-term focused analysis driven by fundamental data. Note that our analysis may not factor in the latest price-sensitive company announcements or qualitative material. Simply Wall St has no position in any stocks mentioned.
