Is Teledyne Technologies (TDY) Modestly Undervalued? An In-depth Valuation Analysis
Teledyne Technologies Inc (NYSE:TDY) witnessed a daily gain of 4.42%, despite a 3-month loss of -3.28%. The company's Earnings Per Share (EPS) stands at 16.08. But is the stock modestly undervalued? This article aims to provide a comprehensive valuation analysis of Teledyne Technologies (NYSE:TDY) to answer this question.
Company Introduction
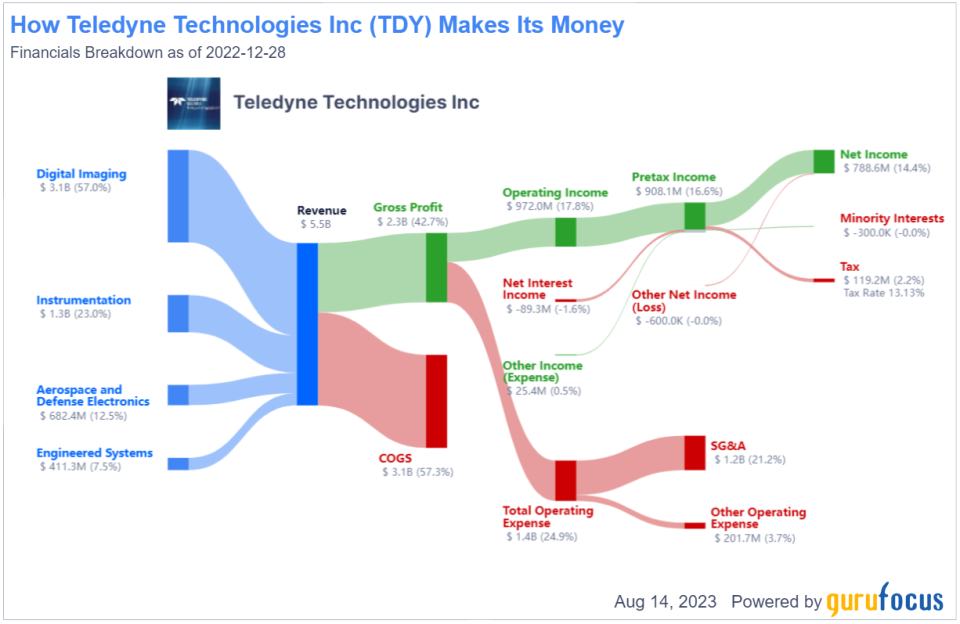
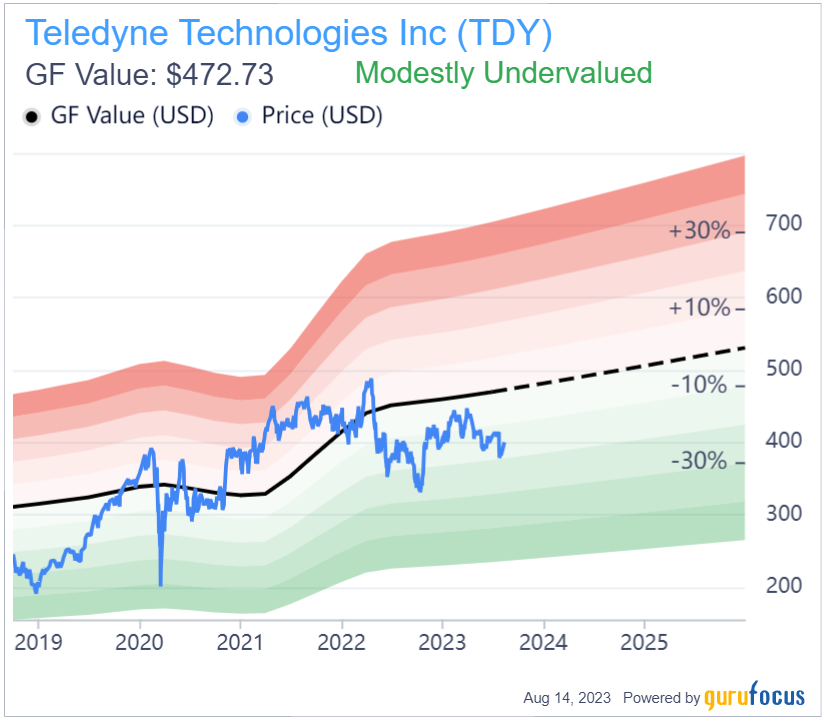
Teledyne Technologies Inc is a technology company that sells to industrial markets, with a significant proportion of its revenue coming from contracts with the U.S. government. The company operates in four segments: instrumentation, digital imaging, aerospace and defense electronics, and engineered systems. With a market cap of $18.80 billion and sales of $5.60 billion, the company's stock price stands at $400.33, while its GF Value, an estimation of fair value, is $472.73. This suggests that the stock might be modestly undervalued.
Understanding GF Value
The GF Value is a proprietary measure that represents the intrinsic value of a stock. It is calculated based on historical multiples, a GuruFocus adjustment factor based on the company's past returns and growth, and future business performance estimates. If the stock price is significantly above the GF Value Line, it is overvalued and its future return is likely to be poor. Conversely, if it is significantly below the GF Value Line, its future return will likely be higher.
Teledyne Technologies (NYSE:TDY) is estimated to be modestly undervalued based on the GF Value. This suggests that the long-term return of its stock is likely to be higher than its business growth.
Financial Strength
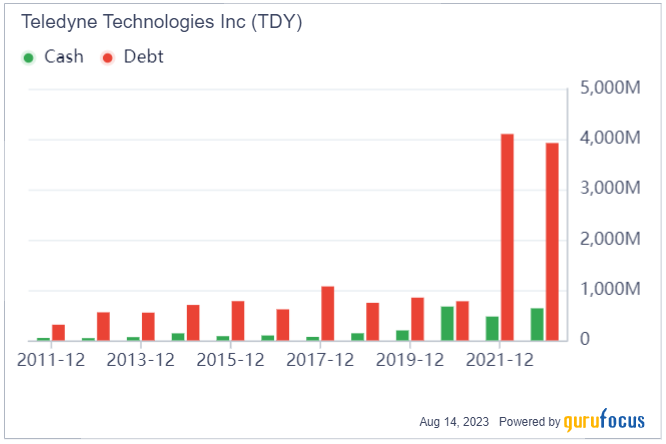
Investing in companies with poor financial strength carries a higher risk of permanent loss. A look at the cash-to-debt ratio and interest coverage can provide a clear understanding of a company's financial strength. With a cash-to-debt ratio of 0.11, Teledyne Technologies fares worse than 94.15% of companies in the hardware industry. However, its overall financial strength is 6 out of 10, indicating fair financial health.
Profitability and Growth
Investing in profitable companies, especially those with consistent profitability over the long term, carries less risk. Teledyne Technologies has been profitable 10 years over the past decade, with an operating margin of 18.2%, ranking better than 90.79% of companies in the hardware industry. The company's profitability rank is 9 out of 10, indicating strong profitability.
Growth is a crucial factor in a company's valuation. Teledyne Technologies' 3-year average annual revenue growth rate is 10.7%, ranking better than 69.08% of companies in the hardware industry. The 3-year average EBITDA growth rate is 19.9%, ranking better than 66.02% of companies in the hardware industry.
Evaluating ROIC and WACC
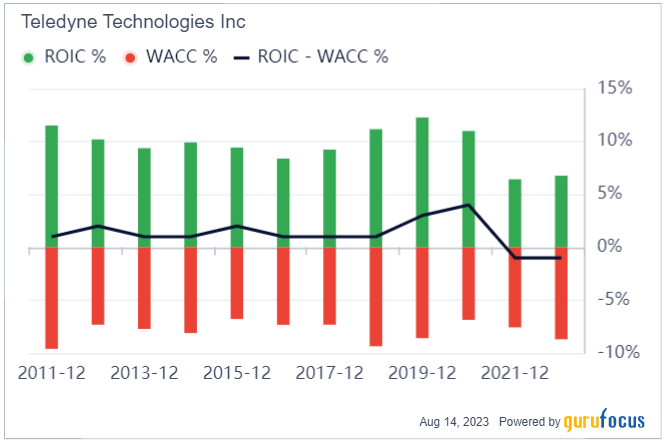
Comparing a company's Return on Invested Capital (ROIC) to its Weighted Average Cost of Capital (WACC) can provide insights into its profitability. Over the past 12 months, Teledyne Technologies' ROIC was 6.64, while its WACC was 9.2.
Conclusion
Based on the analysis, Teledyne Technologies (NYSE:TDY) stock appears to be modestly undervalued. The company's financial condition is fair, and its profitability is strong. Its growth ranks better than 66.02% of companies in the hardware industry. To learn more about Teledyne Technologies stock, you can check out its 30-Year Financials here.
For high-quality companies that may deliver above-average returns, check out the GuruFocus High Quality Low Capex Screener.
This article first appeared on GuruFocus.
