Are Teleflex Incorporated's (NYSE:TFX) Fundamentals Good Enough to Warrant Buying Given The Stock's Recent Weakness?
With its stock down 6.3% over the past three months, it is easy to disregard Teleflex (NYSE:TFX). But if you pay close attention, you might find that its key financial indicators look quite decent, which could mean that the stock could potentially rise in the long-term given how markets usually reward more resilient long-term fundamentals. Specifically, we decided to study Teleflex's ROE in this article.
ROE or return on equity is a useful tool to assess how effectively a company can generate returns on the investment it received from its shareholders. In simpler terms, it measures the profitability of a company in relation to shareholder's equity.
Check out our latest analysis for Teleflex
How Do You Calculate Return On Equity?
The formula for ROE is:
Return on Equity = Net Profit (from continuing operations) ÷ Shareholders' Equity
So, based on the above formula, the ROE for Teleflex is:
8.8% = US$363m ÷ US$4.1b (Based on the trailing twelve months to April 2023).
The 'return' is the income the business earned over the last year. One way to conceptualize this is that for each $1 of shareholders' capital it has, the company made $0.09 in profit.
What Is The Relationship Between ROE And Earnings Growth?
So far, we've learned that ROE is a measure of a company's profitability. Depending on how much of these profits the company reinvests or "retains", and how effectively it does so, we are then able to assess a company’s earnings growth potential. Assuming all else is equal, companies that have both a higher return on equity and higher profit retention are usually the ones that have a higher growth rate when compared to companies that don't have the same features.
Teleflex's Earnings Growth And 8.8% ROE
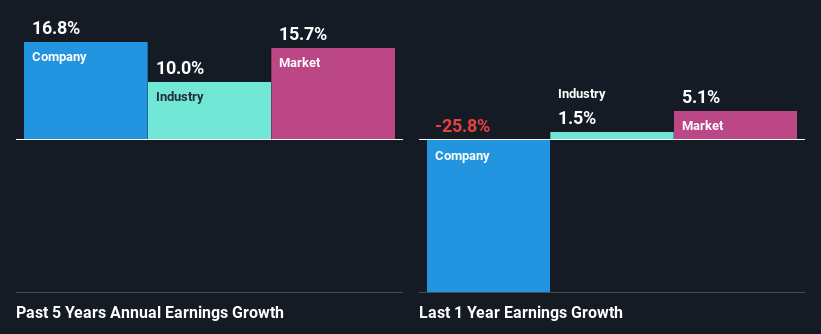
When you first look at it, Teleflex's ROE doesn't look that attractive. However, its ROE is similar to the industry average of 9.8%, so we won't completely dismiss the company. Even so, Teleflex has shown a fairly decent growth in its net income which grew at a rate of 17%. Given the slightly low ROE, it is likely that there could be some other aspects that are driving this growth. For instance, the company has a low payout ratio or is being managed efficiently.
We then compared Teleflex's net income growth with the industry and we're pleased to see that the company's growth figure is higher when compared with the industry which has a growth rate of 10% in the same 5-year period.
Earnings growth is a huge factor in stock valuation. It’s important for an investor to know whether the market has priced in the company's expected earnings growth (or decline). This then helps them determine if the stock is placed for a bright or bleak future. Has the market priced in the future outlook for TFX? You can find out in our latest intrinsic value infographic research report.
Is Teleflex Making Efficient Use Of Its Profits?
Teleflex's three-year median payout ratio to shareholders is 16% (implying that it retains 84% of its income), which is on the lower side, so it seems like the management is reinvesting profits heavily to grow its business.
Besides, Teleflex has been paying dividends for at least ten years or more. This shows that the company is committed to sharing profits with its shareholders. Existing analyst estimates suggest that the company's future payout ratio is expected to drop to 9.3% over the next three years. The fact that the company's ROE is expected to rise to 15% over the same period is explained by the drop in the payout ratio.
Conclusion
In total, it does look like Teleflex has some positive aspects to its business. Even in spite of the low rate of return, the company has posted impressive earnings growth as a result of reinvesting heavily into its business. The latest industry analyst forecasts show that the company is expected to maintain its current growth rate. To know more about the latest analysts predictions for the company, check out this visualization of analyst forecasts for the company.
Have feedback on this article? Concerned about the content? Get in touch with us directly. Alternatively, email editorial-team (at) simplywallst.com.
This article by Simply Wall St is general in nature. We provide commentary based on historical data and analyst forecasts only using an unbiased methodology and our articles are not intended to be financial advice. It does not constitute a recommendation to buy or sell any stock, and does not take account of your objectives, or your financial situation. We aim to bring you long-term focused analysis driven by fundamental data. Note that our analysis may not factor in the latest price-sensitive company announcements or qualitative material. Simply Wall St has no position in any stocks mentioned.
Join A Paid User Research Session
You’ll receive a US$30 Amazon Gift card for 1 hour of your time while helping us build better investing tools for the individual investors like yourself. Sign up here
