TELUS' (TSE:T) investors will be pleased with their favorable 33% return over the last three years
Low-cost index funds make it easy to achieve average market returns. But across the board there are plenty of stocks that underperform the market. Unfortunately for shareholders, while the TELUS Corporation (TSE:T) share price is up 15% in the last three years, that falls short of the market return. Unfortunately, the share price has fallen 10% over twelve months.
So let's assess the underlying fundamentals over the last 3 years and see if they've moved in lock-step with shareholder returns.
Check out our latest analysis for TELUS
In his essay The Superinvestors of Graham-and-Doddsville Warren Buffett described how share prices do not always rationally reflect the value of a business. One imperfect but simple way to consider how the market perception of a company has shifted is to compare the change in the earnings per share (EPS) with the share price movement.
During the three years of share price growth, TELUS actually saw its earnings per share (EPS) drop 10% per year.
Earnings per share have melted like a stack of ice cubes, in stark contrast to the share price. So we'll need to take a look at some different metrics to try to understand why the share price remains solid.
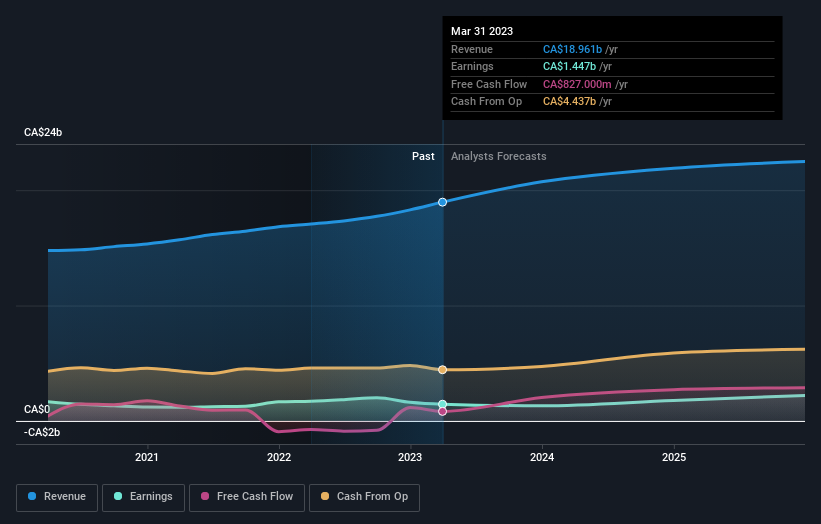
Interestingly, the dividend has increased over time; so that may have given the share price a boost. It could be that the company is reaching maturity and dividend investors are buying for the yield. On top of that, revenue grew at a rate of 8.3% per year, and it's likely investors interpret that as pointing to a brighter future.
The image below shows how earnings and revenue have tracked over time (if you click on the image you can see greater detail).
We like that insiders have been buying shares in the last twelve months. Having said that, most people consider earnings and revenue growth trends to be a more meaningful guide to the business. So it makes a lot of sense to check out what analysts think TELUS will earn in the future (free profit forecasts).
What About Dividends?
When looking at investment returns, it is important to consider the difference between total shareholder return (TSR) and share price return. The TSR is a return calculation that accounts for the value of cash dividends (assuming that any dividend received was reinvested) and the calculated value of any discounted capital raisings and spin-offs. So for companies that pay a generous dividend, the TSR is often a lot higher than the share price return. As it happens, TELUS' TSR for the last 3 years was 33%, which exceeds the share price return mentioned earlier. The dividends paid by the company have thusly boosted the total shareholder return.
A Different Perspective
TELUS shareholders are down 5.5% for the year (even including dividends), but the market itself is up 8.8%. However, keep in mind that even the best stocks will sometimes underperform the market over a twelve month period. Longer term investors wouldn't be so upset, since they would have made 7%, each year, over five years. It could be that the recent sell-off is an opportunity, so it may be worth checking the fundamental data for signs of a long term growth trend. It's always interesting to track share price performance over the longer term. But to understand TELUS better, we need to consider many other factors. For example, we've discovered 3 warning signs for TELUS (2 are concerning!) that you should be aware of before investing here.
TELUS is not the only stock that insiders are buying. For those who like to find winning investments this free list of growing companies with recent insider purchasing, could be just the ticket.
Please note, the market returns quoted in this article reflect the market weighted average returns of stocks that currently trade on Canadian exchanges.
Have feedback on this article? Concerned about the content? Get in touch with us directly. Alternatively, email editorial-team (at) simplywallst.com.
This article by Simply Wall St is general in nature. We provide commentary based on historical data and analyst forecasts only using an unbiased methodology and our articles are not intended to be financial advice. It does not constitute a recommendation to buy or sell any stock, and does not take account of your objectives, or your financial situation. We aim to bring you long-term focused analysis driven by fundamental data. Note that our analysis may not factor in the latest price-sensitive company announcements or qualitative material. Simply Wall St has no position in any stocks mentioned.
Join A Paid User Research Session
You’ll receive a US$30 Amazon Gift card for 1 hour of your time while helping us build better investing tools for the individual investors like yourself. Sign up here
