Should You Be Tempted To Sell Fujian Holdings Limited (HKG:181) Because Of Its P/E Ratio?

Want to participate in a research study? Help shape the future of investing tools and earn a $60 gift card!
This article is written for those who want to get better at using price to earnings ratios (P/E ratios). We'll show how you can use Fujian Holdings Limited's (HKG:181) P/E ratio to inform your assessment of the investment opportunity. Based on the last twelve months, Fujian Holdings's P/E ratio is 25.61. That corresponds to an earnings yield of approximately 3.9%.
View our latest analysis for Fujian Holdings
How Do You Calculate A P/E Ratio?
The formula for price to earnings is:
Price to Earnings Ratio = Price per Share ÷ Earnings per Share (EPS)
Or for Fujian Holdings:
P/E of 25.61 = HK$0.21 ÷ HK$0.0082 (Based on the trailing twelve months to December 2018.)
Is A High Price-to-Earnings Ratio Good?
A higher P/E ratio means that investors are paying a higher price for each HK$1 of company earnings. That isn't a good or a bad thing on its own, but a high P/E means that buyers have a higher opinion of the business's prospects, relative to stocks with a lower P/E.
How Growth Rates Impact P/E Ratios
Earnings growth rates have a big influence on P/E ratios. Earnings growth means that in the future the 'E' will be higher. Therefore, even if you pay a high multiple of earnings now, that multiple will become lower in the future. Then, a lower P/E should attract more buyers, pushing the share price up.
Most would be impressed by Fujian Holdings earnings growth of 18% in the last year. And it has bolstered its earnings per share by 77% per year over the last five years. So one might expect an above average P/E ratio.
How Does Fujian Holdings's P/E Ratio Compare To Its Peers?
The P/E ratio essentially measures market expectations of a company. The image below shows that Fujian Holdings has a higher P/E than the average (14.8) P/E for companies in the hospitality industry.
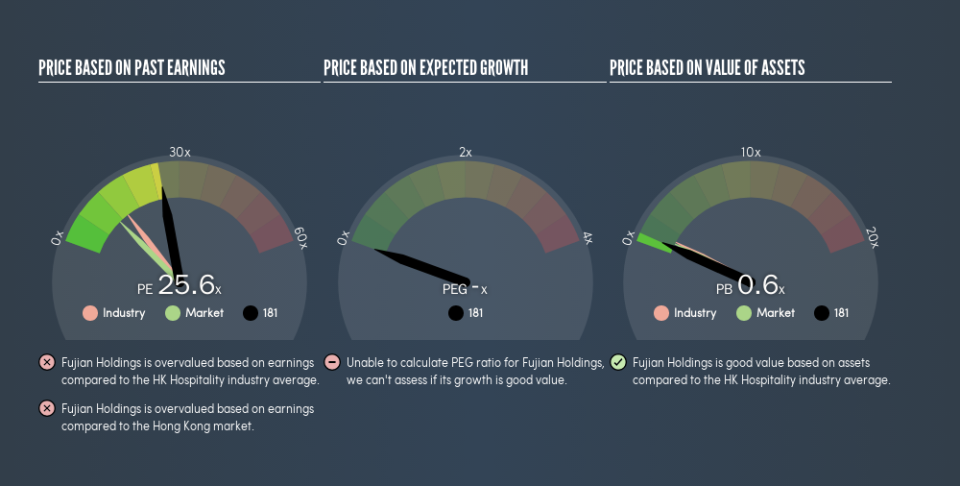
Its relatively high P/E ratio indicates that Fujian Holdings shareholders think it will perform better than other companies in its industry classification. Clearly the market expects growth, but it isn't guaranteed. So investors should delve deeper. I like to check if company insiders have been buying or selling.
Remember: P/E Ratios Don't Consider The Balance Sheet
It's important to note that the P/E ratio considers the market capitalization, not the enterprise value. Thus, the metric does not reflect cash or debt held by the company. Hypothetically, a company could reduce its future P/E ratio by spending its cash (or taking on debt) to achieve higher earnings.
Such expenditure might be good or bad, in the long term, but the point here is that the balance sheet is not reflected by this ratio.
Fujian Holdings's Balance Sheet
Fujian Holdings has net cash of HK$50m. That should lead to a higher P/E than if it did have debt, because its strong balance sheets gives it more options.
The Bottom Line On Fujian Holdings's P/E Ratio
Fujian Holdings trades on a P/E ratio of 25.6, which is above the HK market average of 11.2. Its strong balance sheet gives the company plenty of resources for extra growth, and it has already proven it can grow. So it does not seem strange that the P/E is above average.
Investors should be looking to buy stocks that the market is wrong about. People often underestimate remarkable growth -- so investors can make money when fast growth is not fully appreciated. We don't have analyst forecasts, but you might want to assess this data-rich visualization of earnings, revenue and cash flow.
Of course you might be able to find a better stock than Fujian Holdings. So you may wish to see this free collection of other companies that have grown earnings strongly.
We aim to bring you long-term focused research analysis driven by fundamental data. Note that our analysis may not factor in the latest price-sensitive company announcements or qualitative material.
If you spot an error that warrants correction, please contact the editor at editorial-team@simplywallst.com. This article by Simply Wall St is general in nature. It does not constitute a recommendation to buy or sell any stock, and does not take account of your objectives, or your financial situation. Simply Wall St has no position in the stocks mentioned. Thank you for reading.
