Should You Be Tempted To Sell NOS, S.G.P.S., S.A. (ELI:NOS) Because Of Its P/E Ratio?

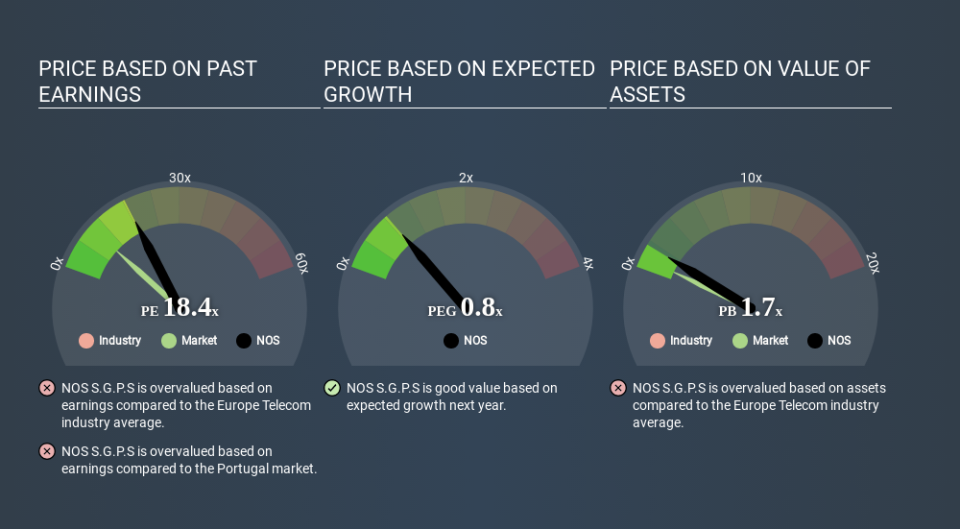
The goal of this article is to teach you how to use price to earnings ratios (P/E ratios). We'll apply a basic P/E ratio analysis to NOS, S.G.P.S., S.A.'s (ELI:NOS), to help you decide if the stock is worth further research. NOS S.G.P.S has a price to earnings ratio of 18.42, based on the last twelve months. That means that at current prices, buyers pay €18.42 for every €1 in trailing yearly profits.
Check out our latest analysis for NOS S.G.P.S
How Do You Calculate A P/E Ratio?
The formula for price to earnings is:
Price to Earnings Ratio = Share Price ÷ Earnings per Share (EPS)
Or for NOS S.G.P.S:
P/E of 18.42 = €3.266 ÷ €0.177 (Based on the trailing twelve months to March 2020.)
(Note: the above calculation results may not be precise due to rounding.)
Is A High Price-to-Earnings Ratio Good?
The higher the P/E ratio, the higher the price tag of a business, relative to its trailing earnings. That isn't necessarily good or bad, but a high P/E implies relatively high expectations of what a company can achieve in the future.
How Does NOS S.G.P.S's P/E Ratio Compare To Its Peers?
The P/E ratio essentially measures market expectations of a company. The image below shows that NOS S.G.P.S has a P/E ratio that is roughly in line with the telecom industry average (18.2).
NOS S.G.P.S's P/E tells us that market participants think its prospects are roughly in line with its industry. If the company has better than average prospects, then the market might be underestimating it. Further research into factors such as insider buying and selling, could help you form your own view on whether that is likely.
How Growth Rates Impact P/E Ratios
If earnings fall then in the future the 'E' will be lower. That means unless the share price falls, the P/E will increase in a few years. A higher P/E should indicate the stock is expensive relative to others -- and that may encourage shareholders to sell.
NOS S.G.P.S shrunk earnings per share by 39% over the last year. But over the longer term (5 years) earnings per share have increased by 4.6%. And it has shrunk its earnings per share by 2.6% per year over the last three years. This growth rate might warrant a low P/E ratio.
A Limitation: P/E Ratios Ignore Debt and Cash In The Bank
One drawback of using a P/E ratio is that it considers market capitalization, but not the balance sheet. So it won't reflect the advantage of cash, or disadvantage of debt. The exact same company would hypothetically deserve a higher P/E ratio if it had a strong balance sheet, than if it had a weak one with lots of debt, because a cashed up company can spend on growth.
Spending on growth might be good or bad a few years later, but the point is that the P/E ratio does not account for the option (or lack thereof).
How Does NOS S.G.P.S's Debt Impact Its P/E Ratio?
NOS S.G.P.S has net debt equal to 48% of its market cap. While that's enough to warrant consideration, it doesn't really concern us.
The Verdict On NOS S.G.P.S's P/E Ratio
NOS S.G.P.S trades on a P/E ratio of 18.4, which is above its market average of 9.9. With modest debt but no EPS growth in the last year, it's fair to say the P/E implies some optimism about future earnings, from the market.
Investors should be looking to buy stocks that the market is wrong about. As value investor Benjamin Graham famously said, 'In the short run, the market is a voting machine but in the long run, it is a weighing machine. So this free visual report on analyst forecasts could hold the key to an excellent investment decision.
You might be able to find a better buy than NOS S.G.P.S. If you want a selection of possible winners, check out this free list of interesting companies that trade on a P/E below 20 (but have proven they can grow earnings).
Love or hate this article? Concerned about the content? Get in touch with us directly. Alternatively, email editorial-team@simplywallst.com.
This article by Simply Wall St is general in nature. It does not constitute a recommendation to buy or sell any stock, and does not take account of your objectives, or your financial situation. We aim to bring you long-term focused analysis driven by fundamental data. Note that our analysis may not factor in the latest price-sensitive company announcements or qualitative material. Simply Wall St has no position in any stocks mentioned. Thank you for reading.
