Should You Be Tempted To Sell Savaria Corporation (TSE:SIS) At Its Current PE Ratio?

This article is intended for those of you who are at the beginning of your investing journey and want to start learning about core concepts of fundamental analysis on practical examples from today’s market.
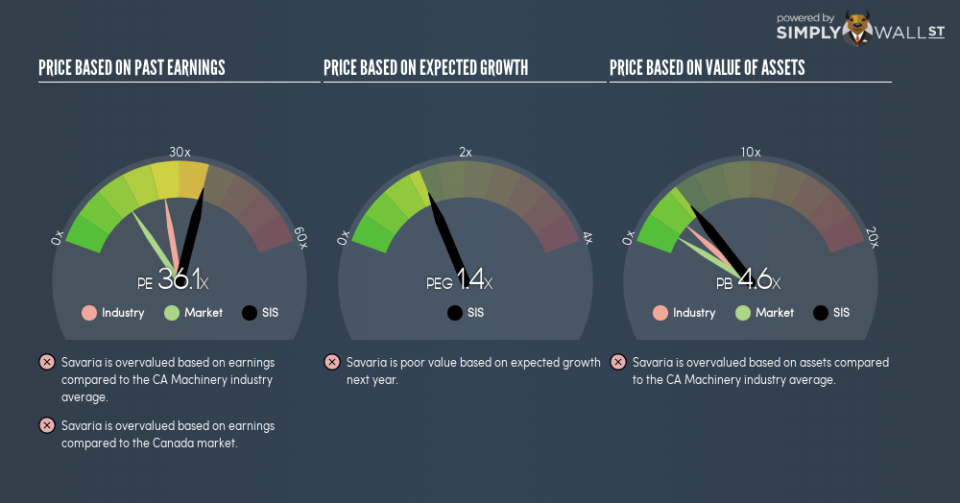
Savaria Corporation (TSE:SIS) trades with a trailing P/E of 36.1, which is higher than the industry average of 25.8. Though this might seem to be a negative, you might change your mind after I explain the assumptions behind the P/E ratio. Today, I will explain what the P/E ratio is as well as what you should look out for when using it.
See our latest analysis for Savaria
Breaking down the P/E ratio
The P/E ratio is one of many ratios used in relative valuation. By comparing a stock’s price per share to its earnings per share, we are able to see how much investors are paying for each dollar of the company’s earnings.
P/E Calculation for SIS
Price-Earnings Ratio = Price per share ÷ Earnings per share
SIS Price-Earnings Ratio = CA$20.12 ÷ CA$0.557 = 36.1x
On its own, the P/E ratio doesn’t tell you much; however, it becomes extremely useful when you compare it with other similar companies. We want to compare the stock’s P/E ratio to the average of companies that have similar characteristics as SIS, such as size and country of operation. A quick method of creating a peer group is to use companies in the same industry, which is what I will do. SIS’s P/E of 36.1 is higher than its industry peers (25.8), which implies that each dollar of SIS’s earnings is being overvalued by investors. This multiple is a median of profitable companies of 9 Machinery companies in CA including Sigma Industries, Exco Technologies and Reko International Group. You could think of it like this: the market is pricing SIS as if it is a stronger company than the average of its industry group.
A few caveats
However, it is important to note that our examination of the stock is based on certain assumptions. The first is that our “similar companies” are actually similar to SIS. If not, the difference in P/E might be a result of other factors. Take, for example, the scenario where Savaria Corporation is growing profits more quickly than the average comparable company. In that case, the market may be correct to value it on a higher P/E ratio. We should also be aware that the stocks we are comparing to SIS may not be fairly valued. Thus while we might conclude that it is richly valued relative to its peers, that could be explained by the peer group being undervalued.
What this means for you:
You may have already conducted fundamental analysis on the stock as a shareholder, so its current overvaluation could signal a potential selling opportunity to reduce your exposure to SIS. Now that you understand the ins and outs of the PE metric, you should know to bear in mind its limitations before you make an investment decision. Remember that basing your investment decision off one metric alone is certainly not sufficient. There are many things I have not taken into account in this article and the PE ratio is very one-dimensional. If you have not done so already, I urge you to complete your research by taking a look at the following:
Future Outlook: What are well-informed industry analysts predicting for SIS’s future growth? Take a look at our free research report of analyst consensus for SIS’s outlook.
Past Track Record: Has SIS been consistently performing well irrespective of the ups and downs in the market? Go into more detail in the past performance analysis and take a look at the free visual representations of SIS’s historicals for more clarity.
Other High-Performing Stocks: Are there other stocks that provide better prospects with proven track records? Explore our free list of these great stocks here.
To help readers see past the short term volatility of the financial market, we aim to bring you a long-term focused research analysis purely driven by fundamental data. Note that our analysis does not factor in the latest price-sensitive company announcements.
The author is an independent contributor and at the time of publication had no position in the stocks mentioned. For errors that warrant correction please contact the editor at editorial-team@simplywallst.com.
