Should You Be Tempted To Sell Sika AG (VTX:SIKA) Because Of Its P/E Ratio?

The goal of this article is to teach you how to use price to earnings ratios (P/E ratios). To keep it practical, we'll show how Sika AG's (VTX:SIKA) P/E ratio could help you assess the value on offer. Based on the last twelve months, Sika's P/E ratio is 32.33. In other words, at today's prices, investors are paying CHF32.33 for every CHF1 in prior year profit.
View our latest analysis for Sika
How Do You Calculate Sika's P/E Ratio?
The formula for P/E is:
Price to Earnings Ratio = Price per Share ÷ Earnings per Share (EPS)
Or for Sika:
P/E of 32.33 = CHF151.75 ÷ CHF4.69 (Based on the trailing twelve months to December 2018.)
Is A High Price-to-Earnings Ratio Good?
A higher P/E ratio means that investors are paying a higher price for each CHF1 of company earnings. That is not a good or a bad thing per se, but a high P/E does imply buyers are optimistic about the future.
How Growth Rates Impact P/E Ratios
Probably the most important factor in determining what P/E a company trades on is the earnings growth. If earnings are growing quickly, then the 'E' in the equation will increase faster than it would otherwise. That means unless the share price increases, the P/E will reduce in a few years. Then, a lower P/E should attract more buyers, pushing the share price up.
Sika increased earnings per share by an impressive 11% over the last twelve months. And it has bolstered its earnings per share by 16% per year over the last five years. So one might expect an above average P/E ratio.
How Does Sika's P/E Ratio Compare To Its Peers?
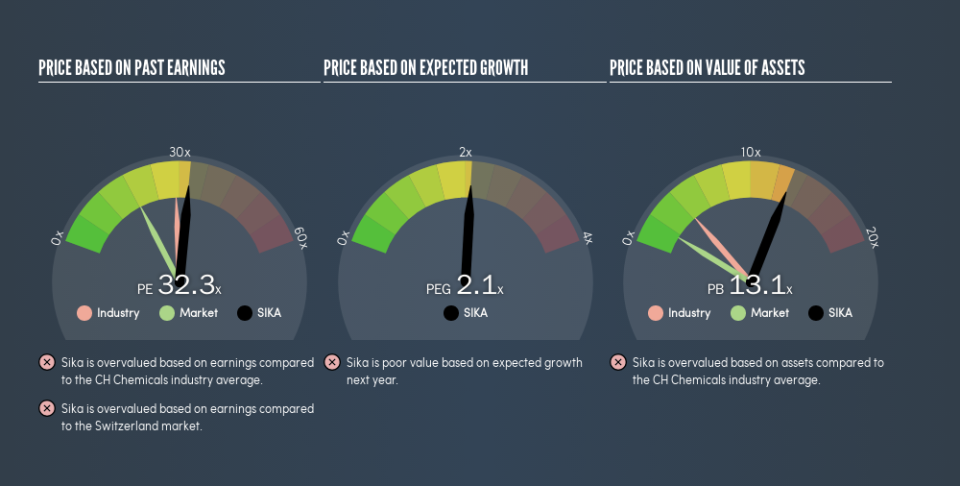
The P/E ratio indicates whether the market has higher or lower expectations of a company. The image below shows that Sika has a higher P/E than the average (29) P/E for companies in the chemicals industry.
Sika's P/E tells us that market participants think the company will perform better than its industry peers, going forward. Shareholders are clearly optimistic, but the future is always uncertain. So investors should delve deeper. I like to check if company insiders have been buying or selling.
A Limitation: P/E Ratios Ignore Debt and Cash In The Bank
One drawback of using a P/E ratio is that it considers market capitalization, but not the balance sheet. In other words, it does not consider any debt or cash that the company may have on the balance sheet. The exact same company would hypothetically deserve a higher P/E ratio if it had a strong balance sheet, than if it had a weak one with lots of debt, because a cashed up company can spend on growth.
Spending on growth might be good or bad a few years later, but the point is that the P/E ratio does not account for the option (or lack thereof).
How Does Sika's Debt Impact Its P/E Ratio?
Sika has net debt worth just 9.8% of its market capitalization. So it doesn't have as many options as it would with net cash, but its debt would not have much of an impact on its P/E ratio.
The Bottom Line On Sika's P/E Ratio
Sika trades on a P/E ratio of 32.3, which is above the CH market average of 18.4. Its debt levels do not imperil its balance sheet and it is growing EPS strongly. So on this analysis it seems reasonable that its P/E ratio is above average.
When the market is wrong about a stock, it gives savvy investors an opportunity. If the reality for a company is better than it expects, you can make money by buying and holding for the long term. So this free visual report on analyst forecasts could hold the key to an excellent investment decision.
But note: Sika may not be the best stock to buy. So take a peek at this free list of interesting companies with strong recent earnings growth (and a P/E ratio below 20).
We aim to bring you long-term focused research analysis driven by fundamental data. Note that our analysis may not factor in the latest price-sensitive company announcements or qualitative material.
If you spot an error that warrants correction, please contact the editor at editorial-team@simplywallst.com. This article by Simply Wall St is general in nature. It does not constitute a recommendation to buy or sell any stock, and does not take account of your objectives, or your financial situation. Simply Wall St has no position in the stocks mentioned. Thank you for reading.
