Should You Be Tempted To Sell Stanley Black & Decker, Inc. (NYSE:SWK) Because Of Its P/E Ratio?

This article is for investors who would like to improve their understanding of price to earnings ratios (P/E ratios). We'll look at Stanley Black & Decker, Inc.'s (NYSE:SWK) P/E ratio and reflect on what it tells us about the company's share price. Based on the last twelve months, Stanley Black & Decker's P/E ratio is 35.53. In other words, at today's prices, investors are paying $35.53 for every $1 in prior year profit.
See our latest analysis for Stanley Black & Decker
How Do I Calculate Stanley Black & Decker's Price To Earnings Ratio?
The formula for P/E is:
Price to Earnings Ratio = Price per Share ÷ Earnings per Share (EPS)
Or for Stanley Black & Decker:
P/E of 35.53 = $144.38 ÷ $4.06 (Based on the year to December 2018.)
Is A High Price-to-Earnings Ratio Good?
A higher P/E ratio means that investors are paying a higher price for each $1 of company earnings. That isn't a good or a bad thing on its own, but a high P/E means that buyers have a higher opinion of the business's prospects, relative to stocks with a lower P/E.
How Growth Rates Impact P/E Ratios
When earnings fall, the 'E' decreases, over time. Therefore, even if you pay a low multiple of earnings now, that multiple will become higher in the future. A higher P/E should indicate the stock is expensive relative to others -- and that may encourage shareholders to sell.
Stanley Black & Decker's earnings per share fell by 50% in the last twelve months. But EPS is up 3.9% over the last 5 years. And over the longer term (3 years) earnings per share have decreased 13% annually. This might lead to low expectations.
How Does Stanley Black & Decker's P/E Ratio Compare To Its Peers?
We can get an indication of market expectations by looking at the P/E ratio. The image below shows that Stanley Black & Decker has a higher P/E than the average (21.1) P/E for companies in the machinery industry.
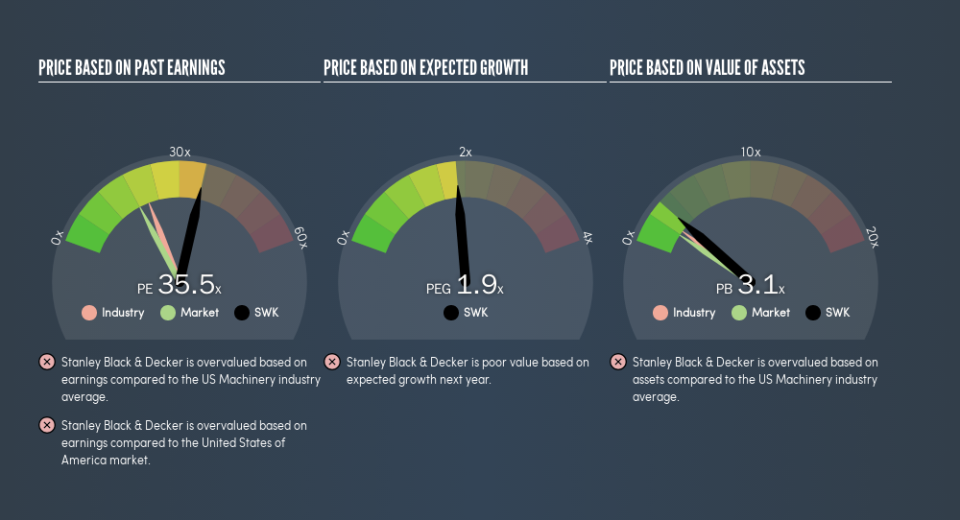
Stanley Black & Decker's P/E tells us that market participants think the company will perform better than its industry peers, going forward. Shareholders are clearly optimistic, but the future is always uncertain. So investors should always consider the P/E ratio alongside other factors, such as whether company directors have been buying shares.
Don't Forget: The P/E Does Not Account For Debt or Bank Deposits
It's important to note that the P/E ratio considers the market capitalization, not the enterprise value. So it won't reflect the advantage of cash, or disadvantage of debt. The exact same company would hypothetically deserve a higher P/E ratio if it had a strong balance sheet, than if it had a weak one with lots of debt, because a cashed up company can spend on growth.
While growth expenditure doesn't always pay off, the point is that it is a good option to have; but one that the P/E ratio ignores.
So What Does Stanley Black & Decker's Balance Sheet Tell Us?
Stanley Black & Decker's net debt is 18% of its market cap. It would probably deserve a higher P/E ratio if it was net cash, since it would have more options for growth.
The Verdict On Stanley Black & Decker's P/E Ratio
Stanley Black & Decker's P/E is 35.5 which is above average (18.1) in the US market. With a bit of debt, but a lack of recent growth, it's safe to say the market is expecting improved profit performance from the company, in the next few years.
Investors have an opportunity when market expectations about a stock are wrong. People often underestimate remarkable growth -- so investors can make money when fast growth is not fully appreciated. So this free report on the analyst consensus forecasts could help you make a master move on this stock.
But note: Stanley Black & Decker may not be the best stock to buy. So take a peek at this free list of interesting companies with strong recent earnings growth (and a P/E ratio below 20).
We aim to bring you long-term focused research analysis driven by fundamental data. Note that our analysis may not factor in the latest price-sensitive company announcements or qualitative material.
If you spot an error that warrants correction, please contact the editor at editorial-team@simplywallst.com. This article by Simply Wall St is general in nature. It does not constitute a recommendation to buy or sell any stock, and does not take account of your objectives, or your financial situation. Simply Wall St has no position in the stocks mentioned. Thank you for reading.
