Should You Be Tempted To Sell Stanley Black & Decker, Inc. (NYSE:SWK) Because Of Its P/E Ratio?

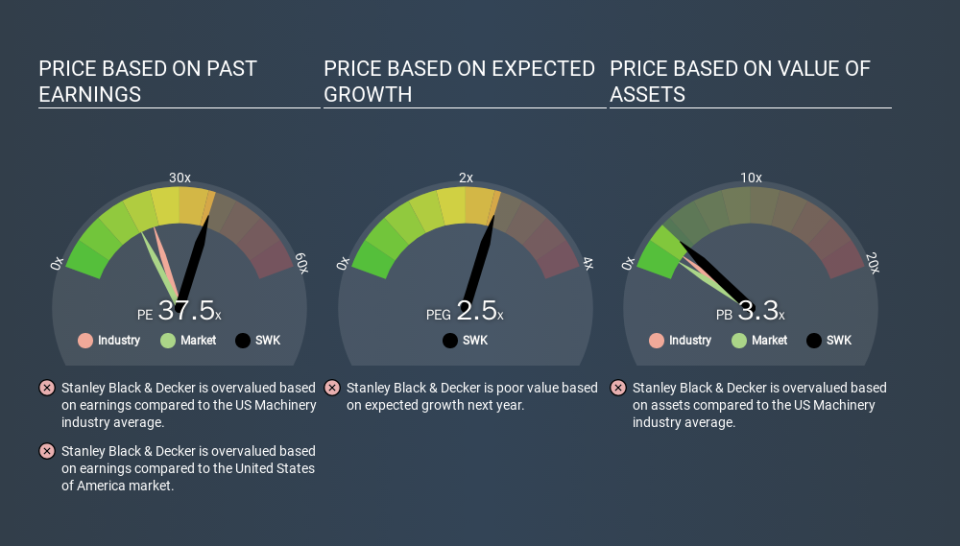
Today, we'll introduce the concept of the P/E ratio for those who are learning about investing. We'll apply a basic P/E ratio analysis to Stanley Black & Decker, Inc.'s (NYSE:SWK), to help you decide if the stock is worth further research. Stanley Black & Decker has a price to earnings ratio of 37.48, based on the last twelve months. That corresponds to an earnings yield of approximately 2.7%.
See our latest analysis for Stanley Black & Decker
How Do You Calculate Stanley Black & Decker's P/E Ratio?
The formula for P/E is:
Price to Earnings Ratio = Price per Share ÷ Earnings per Share (EPS)
Or for Stanley Black & Decker:
P/E of 37.48 = $164.54 ÷ $4.39 (Based on the year to September 2019.)
Is A High Price-to-Earnings Ratio Good?
A higher P/E ratio means that buyers have to pay a higher price for each $1 the company has earned over the last year. All else being equal, it's better to pay a low price -- but as Warren Buffett said, 'It's far better to buy a wonderful company at a fair price than a fair company at a wonderful price.
How Does Stanley Black & Decker's P/E Ratio Compare To Its Peers?
One good way to get a quick read on what market participants expect of a company is to look at its P/E ratio. As you can see below, Stanley Black & Decker has a higher P/E than the average company (22.5) in the machinery industry.
Stanley Black & Decker's P/E tells us that market participants think the company will perform better than its industry peers, going forward. Clearly the market expects growth, but it isn't guaranteed. So investors should delve deeper. I like to check if company insiders have been buying or selling.
How Growth Rates Impact P/E Ratios
Companies that shrink earnings per share quickly will rapidly decrease the 'E' in the equation. That means even if the current P/E is low, it will increase over time if the share price stays flat. A higher P/E should indicate the stock is expensive relative to others -- and that may encourage shareholders to sell.
Stanley Black & Decker saw earnings per share decrease by 34% last year. And it has shrunk its earnings per share by 13% per year over the last three years. This could justify a low P/E.
Remember: P/E Ratios Don't Consider The Balance Sheet
One drawback of using a P/E ratio is that it considers market capitalization, but not the balance sheet. So it won't reflect the advantage of cash, or disadvantage of debt. Theoretically, a business can improve its earnings (and produce a lower P/E in the future) by investing in growth. That means taking on debt (or spending its cash).
Spending on growth might be good or bad a few years later, but the point is that the P/E ratio does not account for the option (or lack thereof).
So What Does Stanley Black & Decker's Balance Sheet Tell Us?
Stanley Black & Decker's net debt is 20% of its market cap. It would probably deserve a higher P/E ratio if it was net cash, since it would have more options for growth.
The Verdict On Stanley Black & Decker's P/E Ratio
Stanley Black & Decker has a P/E of 37.5. That's higher than the average in its market, which is 18.6. With some debt but no EPS growth last year, the market has high expectations of future profits.
Investors should be looking to buy stocks that the market is wrong about. People often underestimate remarkable growth -- so investors can make money when fast growth is not fully appreciated. So this free visual report on analyst forecasts could hold the key to an excellent investment decision.
Of course you might be able to find a better stock than Stanley Black & Decker. So you may wish to see this free collection of other companies that have grown earnings strongly.
If you spot an error that warrants correction, please contact the editor at editorial-team@simplywallst.com. This article by Simply Wall St is general in nature. It does not constitute a recommendation to buy or sell any stock, and does not take account of your objectives, or your financial situation. Simply Wall St has no position in the stocks mentioned.
We aim to bring you long-term focused research analysis driven by fundamental data. Note that our analysis may not factor in the latest price-sensitive company announcements or qualitative material. Thank you for reading.
