Is Tenable Holdings (TENB) A Hidden Gem? An In-Depth Look at Its Valuation
Tenable Holdings Inc (NASDAQ:TENB) saw a daily gain of 4.4%, and a 3-month gain of 10.94%, despite a Loss Per Share of 0.72. These figures raise the question: Is the stock modestly undervalued? This article aims to provide an in-depth analysis of Tenable Holdings' valuation using GuruFocus' proprietary valuation method, the GF Value. We encourage readers to delve into the following analysis to gain a comprehensive understanding of Tenable Holdings' intrinsic value.
Company Overview
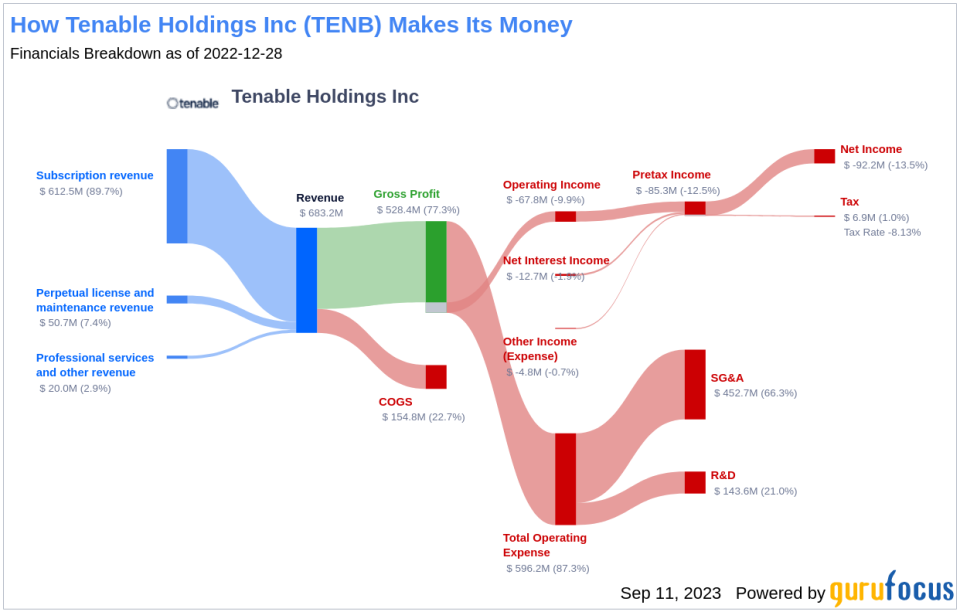
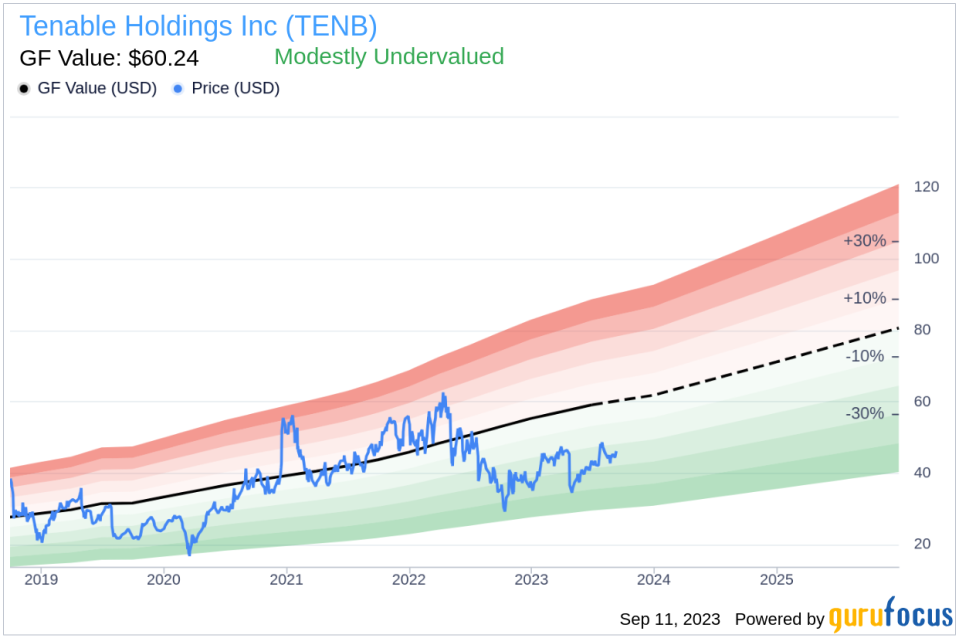
Tenable Holdings Inc is a leading provider of exposure management solutions, offering a suite of products that equip organizations with a risk-based view of traditional and modern attack surfaces. The company operates globally, with a majority of its revenue derived from the Americas. The current stock price stands at $46.17, while our GF Value estimates the fair value at $60.24, indicating that Tenable Holdings may be modestly undervalued.
Understanding GF Value
The GF Value is a unique measure of a stock's intrinsic value, calculated based on three key factors: historical multiples, an internal adjustment based on the company's past business growth, and analyst estimates of future business performance. The GF Value Line gives an overview of the fair value that the stock should be traded at. If the stock's share price is significantly above the GF Value Line, the stock may be overvalued and have poor future returns. Conversely, if the stock's share price is significantly below the GF Value Line, the stock may be undervalued and have high future returns.
Based on our GF Value, Tenable Holdings, with a market cap of $5.30 billion, appears to be modestly undervalued. This suggests that the long-term return of its stock is likely to be higher than its business growth.
Financial Strength
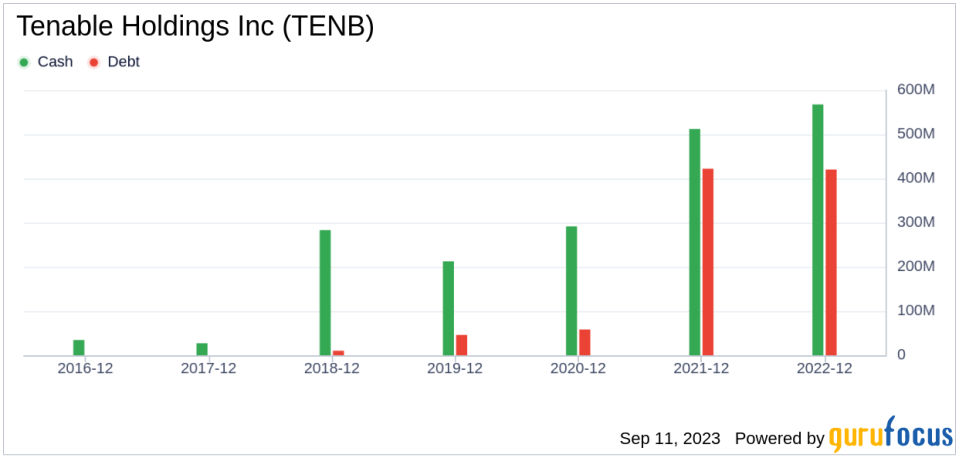
Companies with poor financial strength expose investors to a high risk of permanent capital loss. To avoid this, investors must review a company's financial strength before purchasing shares. Key indicators of financial strength are the cash-to-debt ratio and interest coverage. Tenable Holdings has a cash-to-debt ratio of 1.55, which ranks worse than 59.07% of 2734 companies in the Software industry. The overall financial strength of Tenable Holdings is 5 out of 10, indicating fair financial strength.
Profitability and Growth
Investing in profitable companies, especially those with consistent profitability over the long term, is less risky. Tenable Holdings has been profitable 0 times over the past 10 years. Over the past twelve months, the company had a revenue of $743.40 million and a Loss Per Share of $0.72. Its operating margin is -7.66%, which ranks worse than 65.33% of 2714 companies in the Software industry. Overall, the profitability of Tenable Holdings is ranked 3 out of 10, indicating poor profitability.
Growth is a crucial factor in the valuation of a company. Faster-growing companies create more value for shareholders, especially if the growth is profitable. The 3-year average annual revenue growth of Tenable Holdings is 18.4%, which ranks better than 71.37% of 2396 companies in the Software industry. The 3-year average EBITDA growth rate is 23.2%, which ranks better than 71.16% of 1997 companies in the Software industry.
ROIC vs WACC
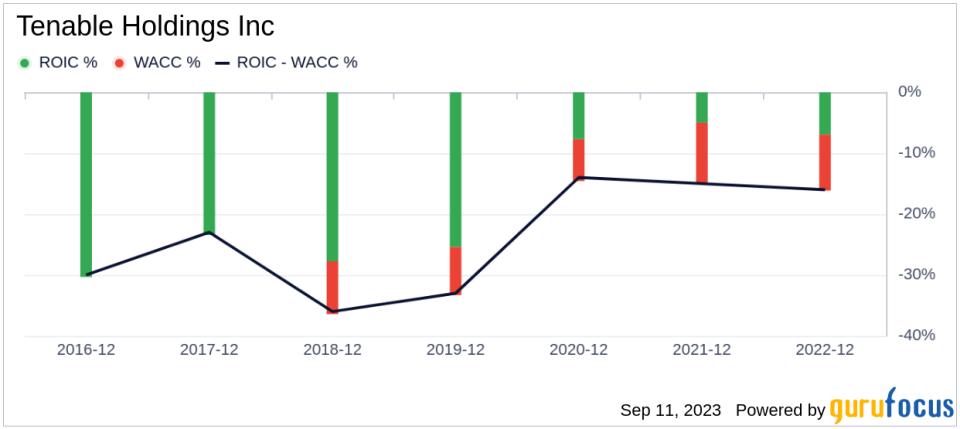
Return on invested capital (ROIC) measures how well a company generates cash flow relative to the capital it has invested in its business. The weighted average cost of capital (WACC) is the rate that a company is expected to pay on average to all its security holders to finance its assets. When the ROIC is higher than the WACC, it implies the company is creating value for shareholders. For the past 12 months, Tenable Holdings's ROIC is -6.02, and its WACC is 8.05.
Conclusion
In conclusion, Tenable Holdings appears to be modestly undervalued. The company's financial condition is fair, and its profitability is poor. However, its growth ranks better than 71.16% of companies in the Software industry. To learn more about Tenable Holdings stock, you can check out its 30-Year Financials here.
To find out high-quality companies that may deliver above-average returns, please check out GuruFocus High Quality Low Capex Screener.
This article first appeared on GuruFocus.
