TFI International Inc (TFII): A Comprehensive GF Score Analysis
TFI International Inc (NYSE:TFII), a leading player in the transportation industry, has been making waves in the stock market. As of July 26, 2023, the company's stock price stands at $127.28, with a market cap of $11.04 billion. The stock has seen a gain of 3.18% today and a significant increase of 19.18% over the past four weeks. This article aims to provide a comprehensive analysis of TFII's performance using the GF Score, a stock performance ranking system developed by GuruFocus.
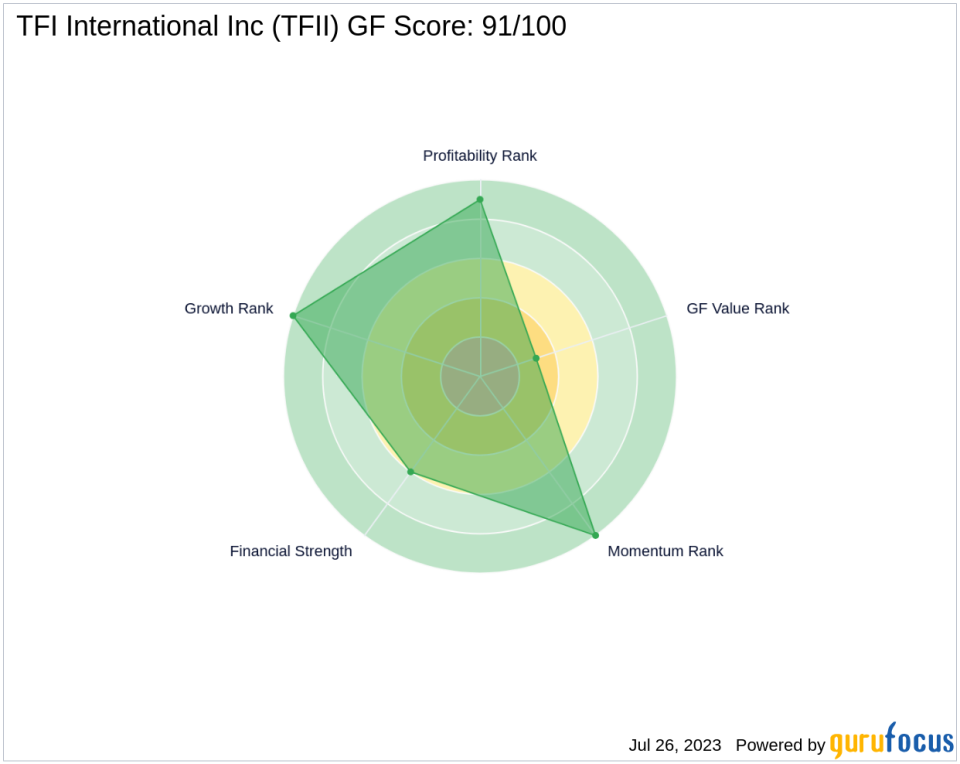
GF Score Analysis
TFII's GF Score stands at an impressive 91 out of 100, indicating the highest outperformance potential. The GF Score is a comprehensive measure of a stock's performance, taking into account five key aspects: Financial Strength, Profitability Rank, Growth Rank, GF Value Rank, and Momentum Rank. A higher GF Score generally correlates with higher returns, making TFII a promising investment.
Financial Strength Rank Analysis
TFII's Financial Strength Rank is 6 out of 10. This rank measures the company's financial situation, considering factors such as its interest coverage (13.42), debt to revenue ratio (0.21), and Altman Z score (4.67). These figures suggest that TFII has a moderate debt burden and a strong financial position.
Profitability Rank Analysis
With a Profitability Rank of 9 out of 10, TFII demonstrates high profitability. This rank considers factors such as the company's Operating Margin (10.42%), Piotroski F-Score (7), and the trend of the Operating Margin (5-year average of 13.10%). TFII's consistent profitability over the past 10 years and a Predictability Rank of 3 further underscore its strong performance.
Growth Rank Analysis
TFII's Growth Rank is a perfect 10 out of 10, indicating robust growth in terms of revenue and profitability. The company's 5-year revenue growth rate is 19.00%, and its 3-year revenue growth rate is 29.60%. Additionally, its 5-year EBITDA growth rate stands at 34.40%, suggesting a consistent increase in the company's business operations.
GF Value Rank Analysis
The GF Value Rank of TFII is 3 out of 10, indicating that the stock is currently overvalued. This rank is determined by the price-to-GF-Value ratio, a proprietary metric calculated based on historical multiples and an adjustment factor based on a company's past returns and growth.
Momentum Rank Analysis
TFII's Momentum Rank is 10 out of 10, suggesting strong future performance. This rank is determined using the standardized momentum ratio and other momentum indicators, reflecting the stock's price performance over the past 12 months.
Competitor Analysis
When compared to its main competitors, TFII holds its ground. Mullen Group Ltd (TSX:MTL) has a GF Score of 87, Old Dominion Freight Line Inc (NASDAQ:ODFL) has a GF Score of 94, and Knight-Swift Transportation Holdings Inc (NYSE:KNX) matches TFII with a GF Score of 91. This comparison underscores TFII's strong performance in the transportation industry.
In conclusion, TFI International Inc (NYSE:TFII) presents a promising investment opportunity, with high GF Score, strong financial strength, impressive profitability, robust growth, and strong momentum. However, investors should be cautious of its current overvaluation as indicated by its GF Value Rank.
This article first appeared on GuruFocus.
