The inverted yield curve and the Leading Economic Index have failed as recession predictors
A version of this piece first appeared on TKer.co
Stocks made new record highs, with the S&P 500 setting an intraday high of 5,261.10 and a closing high of 5,241.53 on Thursday. For the week, the S&P increased 2.3% to close at 5,234.18. The index is now up 9.7% year to date and up 46.3% from its October 12, 2022 closing low of 3,577.03.
Just because something happens much of the time doesn’t mean it happens all of the time. This is true for the stock market, the economy, and probably everything else in our lives.
In recent years, we’ve learned this is true of two of the most popular and historically consistent recession indicators: the yield curve and the Conference Board’s Leading Economic Index.
The inverted yield curve
The yield curve represents the shape that forms on a chart when you plot the interest rate, or yield, for Treasury debt securities with various maturities. Typically, shorter-term rates like the yield on the 2-year Treasury note will be lower than the yield on the 10-year Treasury note.
The yield curve inverts when a longer term rate is lower than a shorter term rate (e.g., when the yield on the 10-year note is lower than yield on the 2-year note).
Historically, when the yield on the 10-year note falls below the yield on the 2-year note (i.e., when the “2s10s” yield curve inverts), recessions have been somewhat soon to follow.
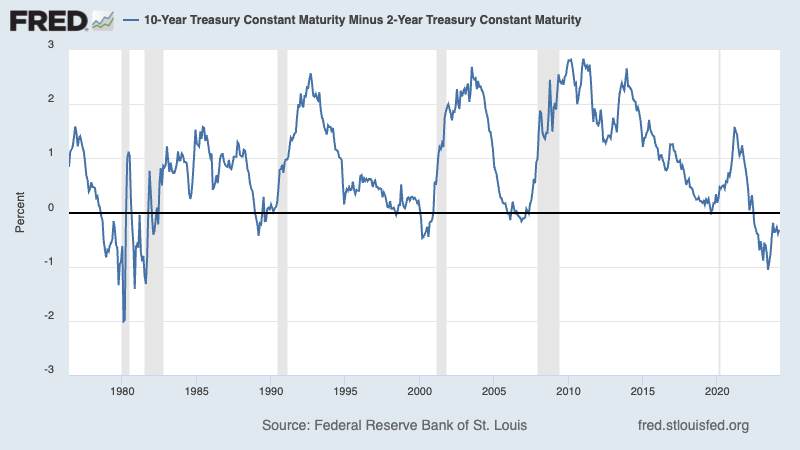
Two years ago, the 2s10s yield curve inverted, which emboldened economists who were warning of an impending recession.
We’re still waiting for that recession.
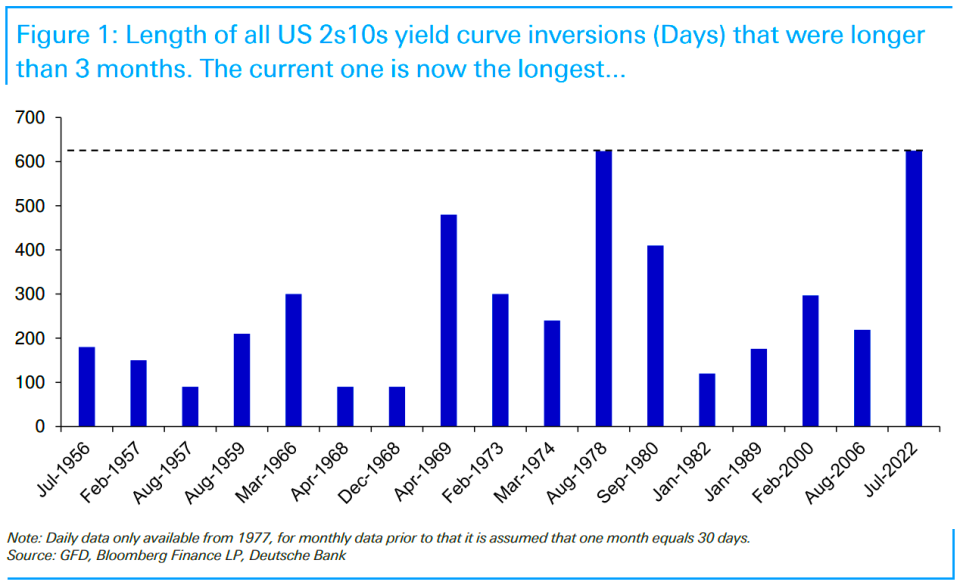
Deutsche Bank’s Jim Reid noted that on Wednesday "we passed the longest continuous U.S. 2s10s inversion in history. Although the 2s10s first inverted at the end of March 2022, it has now been continuously inverted for 625 days since July 5th 2022. That exceeds the 624 day inversion from August 1978, which previously held the record."
While the inverted yield curve may have a good track record of predicting recessions, it’s not very precise in predicting when recessions will start. According to a Goldman Sachs analysis of 2s10s inversions since 1965, seven to 49 months passed before recessions occurred, with a median of 20 months.
So, the economy could go into recession a week, a month, or a year from now, which would arguably confirm the inverted yield curve’s signal.
That said, one has to question the value of an indicator that sometimes leads events by two to four years.
As Oaktree Capital’s Howard Marks says, "Being too far ahead of your time is indistinguishable from being wrong."
The falling Leading Economic Index
The Conference Board’s Leading Economic Index (LEI) — a composite of market and economic metrics — has had a strong track record of predicting recessions, specifically when its six-month average change is negative.
Over the past two years, it too had been signaling a recession that hasn’t come.
And last month, in its January update, The Conference Board said the LEI’s signal flipped positive. From The Conference Board’s Justyna Zabinska-La Monica:
While the declining LEI continues to signal headwinds to economic activity, for the first time in the past two years, six out of its ten components were positive contributors over the past six-month period (ending in January 2024). As a result, the leading index currently does not signal recession ahead. While no longer forecasting a recession in 2024, we do expect real GDP growth to slow to near zero percent over Q2 and Q3
On Wednesday, The Conference Board confirmed that the positive developments continued into February.
"The U.S. LEI rose in February 2024 for the first time since February 2022," Zabinska-La Monica said. "Strength in weekly hours worked in manufacturing, stock prices, the Leading Credit Index, and residential construction drove the LEI’s first monthly increase in two years."

Yardeni Research’s Ed Yardeni and Renaissance Macro’s Neil Dutta are among Wall Street data nerds who’ve pointed out more serious issues with LEI.
The bottom line: The LEI’s signal that people have been citing has been off.
Zooming out
I think it’s good to heed the warnings of the popular recession indicators. But just because a metric is usually right doesn’t mean it will be right the next time around.
Furthermore, it’s never smart to rely too heavily on the signal of a single metric. Whether it’s interest rates, P/E ratios, or one of these recession indicators, any metric should be considered in the context of other relevant metrics.
The recessionary signals we’ve been reading about over the past two years have come amid massive bullish tailwinds like record job openings and excess savings, which have proven to be more reliable leading indicators during the current economic cycle.
Maybe next time the yield curve and the LEI will be right and timely. But not this time.
SocGen raises its target for the S&P 500
On Thursday, Societe Generale’s Manish Kabra raised his year-end target for the S&P 500 to 5,500 from 4,750. This is his first revision from her initial target.
"U.S. exceptionalism is going from strength to strength," Kabra wrote. "Despite widespread market optimism, we view this as rational rather than excessive, as profit growth continues to increase and set new records for the S&P 500."
Kabra is not alone in tweaking his forecasts. His peers at BofA, Barclays, UBS, Goldman Sachs, RBC, and CFRA are among those who’ve also raised their targets.
Don’t be surprised to see more of these revisions as the S&P 500’s performance, so far, has exceeded many strategists’ expectations.

Reviewing the macro crosscurrents
There were a few notable data points and macroeconomic developments from last week to consider:
The Fed holds steady. The Federal Reserve announced it would keep its benchmark interest rate target high at a range of 5.25% to 5.5%.
At the conclusion of its monetary policy meeting on Wednesday, the Fed also maintained its expectation for the equivalent of three 25-basis-point rate cuts in 2024. However, the central bank’s new "dot plots" imply fewer rate cuts in 2025 and 2026 than what it forecasted after the December meeting.
The Fed also boosted its forecast for GDP growth, lowered its forecast for unemployment, and raised its forecast for inflation.
Despite this arguably hawkish update, stocks rallied. Perhaps markets were expecting something even more hawkish.
Card data suggests spending is holding up. From JPMorgan: "As of 13 Mar 2024, our Chase Consumer Card spending data (unadjusted) was 2.4% above the same day last year. Based on the Chase Consumer Card data through 13 Mar 2024, our estimate of the U.S. Census March control measure of retail sales m/m is 0.58%."
From Bank of America: "Total card spending per HH was up 1.1% y/y in the week ending Mar 16, according to BAC aggregated credit & debit card data. Retail ex auto spending per HH came in at 0.5% y/y in the week ending Mar 16. After a soft but stable Feb, Mar spending has improved, likely in part due to the base effect from the Mar slowdown last year."
Unemployment claims tick lower. Initial claims for unemployment benefits declined to 210,000 during the week ending March 16, down from 212,000 the week prior. While this is above the September 2022 low of 182,000, it continues to trend at levels historically associated with economic growth.
Gas prices rise. From AAA: "The national average for a gallon of gas rose 11 cents since last week to $3.52. While domestic gas demand has been lackluster, rising oil prices helped push pump prices higher."

Home sales jump. Sales of previously owned homes increased by 9.5% in February to an annualized rate of 4.38 million units. From NAR chief economist Lawrence Yun: “Additional housing supply is helping to satisfy market demand. … Housing demand has been on a steady rise due to population and job growth, though the actual timing of purchases will be determined by prevailing mortgage rates and wider inventory choices."

Home prices rise. Prices for previously owned homes increased month over month and from year-ago levels. From the NAR: "The median existing-home price for all housing types in February was $384,500, an increase of 5.7% from the prior year ($363,600)."

Homebuilder sentiment rises. From the NAHB’s Carl Harris: "Buyer demand remains brisk and we expect more consumers to jump off the sidelines and into the marketplace if mortgage rates continue to fall later this year. … But even though there is strong pent-up demand, builders continue to face several supply-side challenges, including a scarcity of buildable lots and skilled labor, and new restrictive codes that continue to increase the cost of building homes."

New home construction rises. Housing starts jumped 10.7% in February to an annualized rate of 1.52 million units, according to the Census Bureau. Building permits rose 1.9% to an annualized rate of 1.52 million units.

Mortgage rates tick higher. According to Freddie Mac, the average 30-year fixed-rate mortgage rose to 6.87% from 6.74% the week prior. From Freddie Mac: "After decreasing for a couple of weeks, mortgage rates are once again on the upswing. As the spring homebuying season gets underway, existing home inventory has increased slightly and new home construction has picked up. Despite elevated rates, homebuilders are displaying renewed confidence in the housing market, focusing on the fact that there is a good amount of pent-up demand, an ongoing supply shortage and expectations that the Federal Reserve will cut rates later in the year."

People are still only sorta returning to the office. From Kastle Systems: "Office occupancy dipped slightly this past week to 50.6%, according to Kastle’s 10-city Back to Work Barometer. The peak day was Tuesday at 58.9%. Cities in Texas saw occupancy drop as schools closed for spring break and severe weather impacted the region. Austin dropped over 9 points to 58.1% while Houston and Dallas both fell more than 5 points. Chicago, however rose to 56.4%, returning to its pandemic record high."

This is the stuff pros are worried about. According to BofA’s February Global Fund Manager Survey, fund managers identified "higher inflation" as the "biggest tail risk."

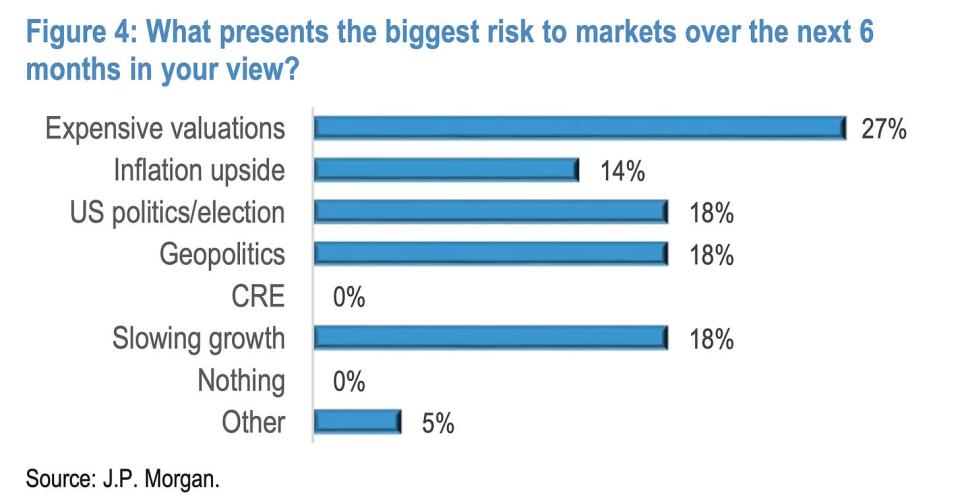
In a different survey, JPMorgan clients identified expensive valuations as the biggest risk to markets.
The truth is we’re always worried about something. That’s just the nature of investing.
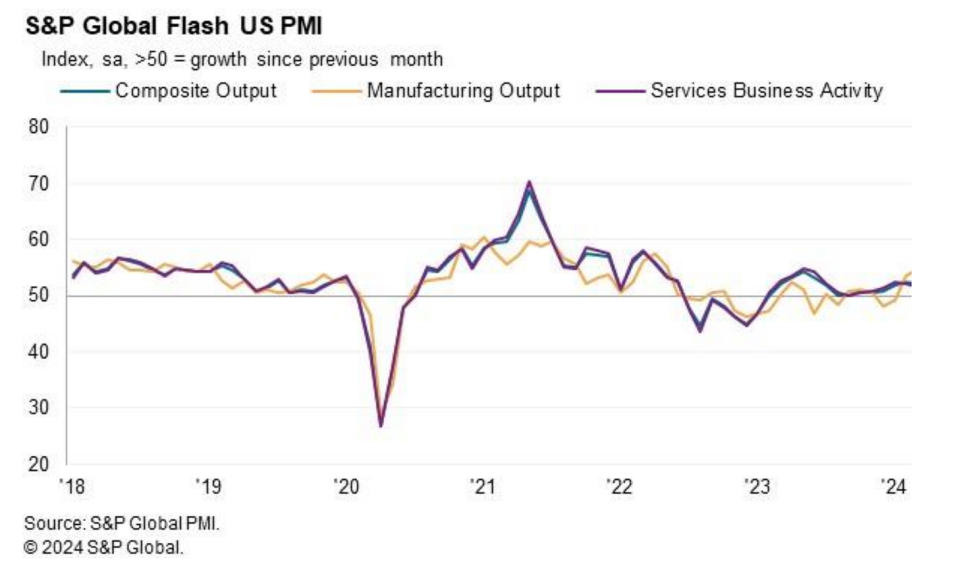
Activity survey signals growth. From S&P Global’s March Flash U.S. PMI:"“Further expansions of both manufacturing and service sector output in March helped close off the U.S. economy’s strongest quarter since the second quarter of last year.
The survey data point to another quarter of robust GDP growth accompanied by sustained hiring as companies continue to report new order growth. The brightest news came from the manufacturing sector, where production is now growing at the fastest rate since May 2022. Production gains are linked to improving demand for goods both at home and abroad, driving a further upturn in business confidence in the outlook."
It’s worth remembering that soft data like the PMI surveys don’t necessarily reflect what’s actually going on in the economy, especially during times of stress.
Near-term GDP growth estimates look good. The Atlanta Fed’s GDPNow model sees real GDP growth climbing at a 2.1% rate in Q1.

Putting it all together
We continue to get evidence that we are experiencing a bullish "Goldilocks" soft landing scenario where inflation cools to manageable levels without the economy having to sink into recession.
This comes as the Federal Reserve continues to employ very tight monetary policy in its ongoing effort to get inflation under control. While it’s true that the Fed has taken a less hawkish tone in 2023 and 2024 than in 2022, and that most economists agree that the final interest rate hike of the cycle has either already happened, inflation still has to stay cool for a little while before the central bank is comfortable with price stability.
So we should expect the central bank to keep monetary policy tight, which means we should be prepared for relatively tight financial conditions (e.g., higher interest rates, tighter lending standards, and lower stock valuations) to linger. All this means monetary policy will be unfriendly to markets for the time being, and the risk the economy slips into a recession will be relatively elevated.
At the same time, we also know that stocks are discounting mechanisms — meaning that prices will have bottomed before the Fed signals a major dovish turn in monetary policy.
Also, it’s important to remember that while recession risks may be elevated, consumers are coming from a very strong financial position. Unemployed people are getting jobs, and those with jobs are getting raises.
Similarly, business finances are healthy as many corporations locked in low interest rates on their debt in recent years. Even as the threat of higher debt servicing costs looms, elevated profit margins give corporations room to absorb higher costs.
At this point, any downturn is unlikely to turn into economic calamity given that the financial health of consumers and businesses remains very strong.
And as always, long-term investors should remember that recessions and bear markets are just part of the deal when you enter the stock market with the aim of generating long-term returns. While markets have had a pretty rough couple of years, the long-run outlook for stocks remains positive.
