We Think Vistry Group (LON:VTY) Can Stay On Top Of Its Debt
Warren Buffett famously said, 'Volatility is far from synonymous with risk.' When we think about how risky a company is, we always like to look at its use of debt, since debt overload can lead to ruin. We can see that Vistry Group PLC (LON:VTY) does use debt in its business. But is this debt a concern to shareholders?
Why Does Debt Bring Risk?
Debt assists a business until the business has trouble paying it off, either with new capital or with free cash flow. In the worst case scenario, a company can go bankrupt if it cannot pay its creditors. While that is not too common, we often do see indebted companies permanently diluting shareholders because lenders force them to raise capital at a distressed price. By replacing dilution, though, debt can be an extremely good tool for businesses that need capital to invest in growth at high rates of return. When we examine debt levels, we first consider both cash and debt levels, together.
See our latest analysis for Vistry Group
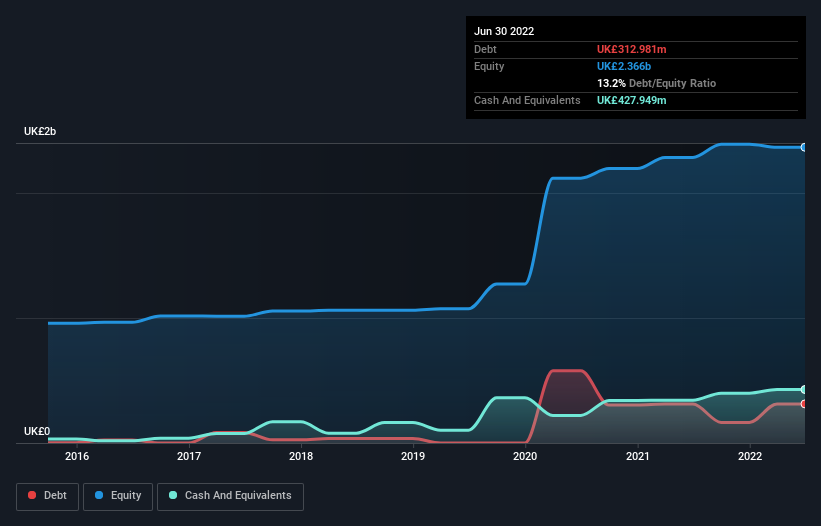
What Is Vistry Group's Debt?
As you can see below, Vistry Group had UK£313.0m of debt, at June 2022, which is about the same as the year before. You can click the chart for greater detail. But on the other hand it also has UK£427.9m in cash, leading to a UK£115.0m net cash position.
A Look At Vistry Group's Liabilities
The latest balance sheet data shows that Vistry Group had liabilities of UK£1.23b due within a year, and liabilities of UK£406.3m falling due after that. Offsetting these obligations, it had cash of UK£427.9m as well as receivables valued at UK£263.4m due within 12 months. So its liabilities outweigh the sum of its cash and (near-term) receivables by UK£940.0m.
This deficit isn't so bad because Vistry Group is worth UK£1.74b, and thus could probably raise enough capital to shore up its balance sheet, if the need arose. But it's clear that we should definitely closely examine whether it can manage its debt without dilution. Despite its noteworthy liabilities, Vistry Group boasts net cash, so it's fair to say it does not have a heavy debt load!
But the other side of the story is that Vistry Group saw its EBIT decline by 5.3% over the last year. If earnings continue to decline at that rate the company may have increasing difficulty managing its debt load. There's no doubt that we learn most about debt from the balance sheet. But ultimately the future profitability of the business will decide if Vistry Group can strengthen its balance sheet over time. So if you're focused on the future you can check out this free report showing analyst profit forecasts.
Finally, a business needs free cash flow to pay off debt; accounting profits just don't cut it. While Vistry Group has net cash on its balance sheet, it's still worth taking a look at its ability to convert earnings before interest and tax (EBIT) to free cash flow, to help us understand how quickly it is building (or eroding) that cash balance. During the last three years, Vistry Group generated free cash flow amounting to a very robust 88% of its EBIT, more than we'd expect. That puts it in a very strong position to pay down debt.
Summing Up
Although Vistry Group's balance sheet isn't particularly strong, due to the total liabilities, it is clearly positive to see that it has net cash of UK£115.0m. And it impressed us with free cash flow of UK£154m, being 88% of its EBIT. So we don't have any problem with Vistry Group's use of debt. There's no doubt that we learn most about debt from the balance sheet. However, not all investment risk resides within the balance sheet - far from it. For example - Vistry Group has 1 warning sign we think you should be aware of.
Of course, if you're the type of investor who prefers buying stocks without the burden of debt, then don't hesitate to discover our exclusive list of net cash growth stocks, today.
Have feedback on this article? Concerned about the content? Get in touch with us directly. Alternatively, email editorial-team (at) simplywallst.com.
This article by Simply Wall St is general in nature. We provide commentary based on historical data and analyst forecasts only using an unbiased methodology and our articles are not intended to be financial advice. It does not constitute a recommendation to buy or sell any stock, and does not take account of your objectives, or your financial situation. We aim to bring you long-term focused analysis driven by fundamental data. Note that our analysis may not factor in the latest price-sensitive company announcements or qualitative material. Simply Wall St has no position in any stocks mentioned.
Join A Paid User Research Session
You’ll receive a US$30 Amazon Gift card for 1 hour of your time while helping us build better investing tools for the individual investors like yourself. Sign up here
