Those who invested in Accrol Group Holdings (LON:ACRL) five years ago are up 66%
Generally speaking the aim of active stock picking is to find companies that provide returns that are superior to the market average. And while active stock picking involves risks (and requires diversification) it can also provide excess returns. For example, long term Accrol Group Holdings plc (LON:ACRL) shareholders have enjoyed a 58% share price rise over the last half decade, well in excess of the market decline of around 1.0% (not including dividends). On the other hand, the more recent gains haven't been so impressive, with shareholders gaining just 43%.
With that in mind, it's worth seeing if the company's underlying fundamentals have been the driver of long term performance, or if there are some discrepancies.
Check out our latest analysis for Accrol Group Holdings
While Accrol Group Holdings made a small profit, in the last year, we think that the market is probably more focussed on the top line growth at the moment. As a general rule, we think this kind of company is more comparable to loss-making stocks, since the actual profit is so low. For shareholders to have confidence a company will grow profits significantly, it must grow revenue.
For the last half decade, Accrol Group Holdings can boast revenue growth at a rate of 6.2% per year. That's a pretty good long term growth rate. While the share price has beat the market, compounding at 10% yearly, over five years, there's certainly some potential that the market hasn't fully considered the growth track record. The key question is whether revenue growth will slow down, and if so, how quickly. There's no doubt that it can be difficult to value pre-profit companies.
The image below shows how earnings and revenue have tracked over time (if you click on the image you can see greater detail).
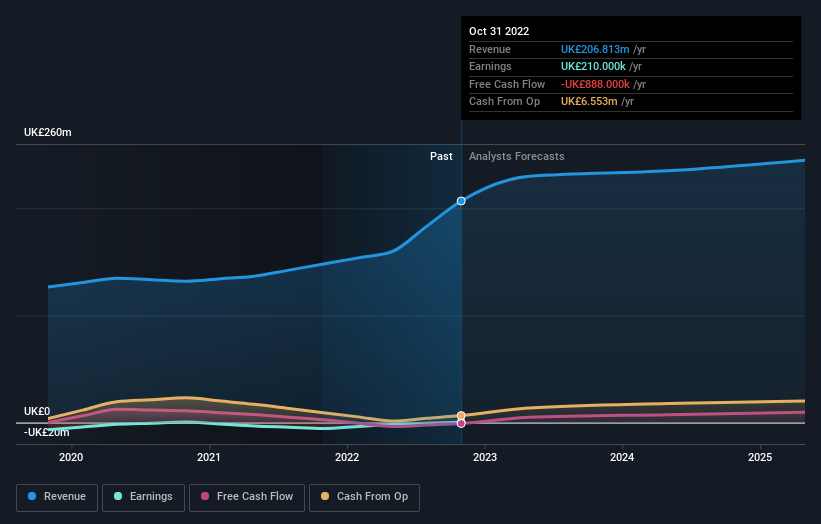
We know that Accrol Group Holdings has improved its bottom line over the last three years, but what does the future have in store? Take a more thorough look at Accrol Group Holdings' financial health with this free report on its balance sheet.
What About The Total Shareholder Return (TSR)?
We'd be remiss not to mention the difference between Accrol Group Holdings' total shareholder return (TSR) and its share price return. Arguably the TSR is a more complete return calculation because it accounts for the value of dividends (as if they were reinvested), along with the hypothetical value of any discounted capital that have been offered to shareholders. Dividends have been really beneficial for Accrol Group Holdings shareholders, and that cash payout contributed to why its TSR of 66%, over the last 5 years, is better than the share price return.
A Different Perspective
It's nice to see that Accrol Group Holdings shareholders have received a total shareholder return of 43% over the last year. Since the one-year TSR is better than the five-year TSR (the latter coming in at 11% per year), it would seem that the stock's performance has improved in recent times. In the best case scenario, this may hint at some real business momentum, implying that now could be a great time to delve deeper. I find it very interesting to look at share price over the long term as a proxy for business performance. But to truly gain insight, we need to consider other information, too. Even so, be aware that Accrol Group Holdings is showing 1 warning sign in our investment analysis , you should know about...
Of course Accrol Group Holdings may not be the best stock to buy. So you may wish to see this free collection of growth stocks.
Please note, the market returns quoted in this article reflect the market weighted average returns of stocks that currently trade on British exchanges.
Have feedback on this article? Concerned about the content? Get in touch with us directly. Alternatively, email editorial-team (at) simplywallst.com.
This article by Simply Wall St is general in nature. We provide commentary based on historical data and analyst forecasts only using an unbiased methodology and our articles are not intended to be financial advice. It does not constitute a recommendation to buy or sell any stock, and does not take account of your objectives, or your financial situation. We aim to bring you long-term focused analysis driven by fundamental data. Note that our analysis may not factor in the latest price-sensitive company announcements or qualitative material. Simply Wall St has no position in any stocks mentioned.
Join A Paid User Research Session
You’ll receive a US$30 Amazon Gift card for 1 hour of your time while helping us build better investing tools for the individual investors like yourself. Sign up here
