Those who invested in AECOM (NYSE:ACM) five years ago are up 207%
The worst result, after buying shares in a company (assuming no leverage), would be if you lose all the money you put in. But on the bright side, you can make far more than 100% on a really good stock. For instance, the price of AECOM (NYSE:ACM) stock is up an impressive 202% over the last five years. It's also up 16% in about a month. But this could be related to good market conditions -- stocks in its market are up 8.4% in the last month.
Now it's worth having a look at the company's fundamentals too, because that will help us determine if the long term shareholder return has matched the performance of the underlying business.
Check out our latest analysis for AECOM
While the efficient markets hypothesis continues to be taught by some, it has been proven that markets are over-reactive dynamic systems, and investors are not always rational. One way to examine how market sentiment has changed over time is to look at the interaction between a company's share price and its earnings per share (EPS).
AECOM's earnings per share are down 7.3% per year, despite strong share price performance over five years.
Essentially, it doesn't seem likely that investors are focused on EPS. Because earnings per share don't seem to match up with the share price, we'll take a look at other metrics instead.
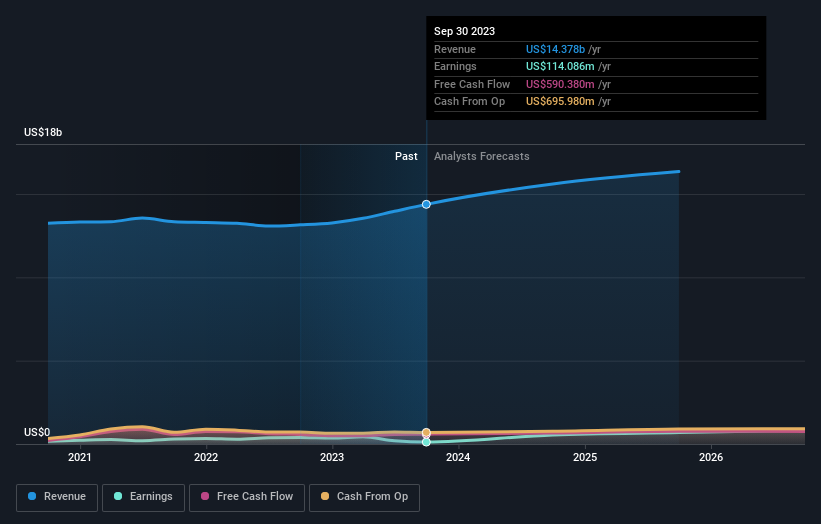
We doubt the modest 1.0% dividend yield is attracting many buyers to the stock. The revenue reduction of 3.2% per year is not a positive. So it seems one might have to take closer look at earnings and revenue trends to see how they might influence the share price.
The company's revenue and earnings (over time) are depicted in the image below (click to see the exact numbers).
This free interactive report on AECOM's balance sheet strength is a great place to start, if you want to investigate the stock further.
What About Dividends?
As well as measuring the share price return, investors should also consider the total shareholder return (TSR). The TSR is a return calculation that accounts for the value of cash dividends (assuming that any dividend received was reinvested) and the calculated value of any discounted capital raisings and spin-offs. Arguably, the TSR gives a more comprehensive picture of the return generated by a stock. In the case of AECOM, it has a TSR of 207% for the last 5 years. That exceeds its share price return that we previously mentioned. And there's no prize for guessing that the dividend payments largely explain the divergence!
A Different Perspective
AECOM shareholders gained a total return of 5.4% during the year. But that return falls short of the market. On the bright side, the longer term returns (running at about 25% a year, over half a decade) look better. Maybe the share price is just taking a breather while the business executes on its growth strategy. While it is well worth considering the different impacts that market conditions can have on the share price, there are other factors that are even more important. For instance, we've identified 3 warning signs for AECOM that you should be aware of.
If you would prefer to check out another company -- one with potentially superior financials -- then do not miss this free list of companies that have proven they can grow earnings.
Please note, the market returns quoted in this article reflect the market weighted average returns of stocks that currently trade on American exchanges.
Have feedback on this article? Concerned about the content? Get in touch with us directly. Alternatively, email editorial-team (at) simplywallst.com.
This article by Simply Wall St is general in nature. We provide commentary based on historical data and analyst forecasts only using an unbiased methodology and our articles are not intended to be financial advice. It does not constitute a recommendation to buy or sell any stock, and does not take account of your objectives, or your financial situation. We aim to bring you long-term focused analysis driven by fundamental data. Note that our analysis may not factor in the latest price-sensitive company announcements or qualitative material. Simply Wall St has no position in any stocks mentioned.
