Those who invested in Doman Building Materials Group (TSE:DBM) five years ago are up 128%
When we invest, we're generally looking for stocks that outperform the market average. Buying under-rated businesses is one path to excess returns. For example, long term Doman Building Materials Group Ltd. (TSE:DBM) shareholders have enjoyed a 44% share price rise over the last half decade, well in excess of the market return of around 25% (not including dividends). On the other hand, the more recent gains haven't been so impressive, with shareholders gaining just 45% , including dividends .
Now it's worth having a look at the company's fundamentals too, because that will help us determine if the long term shareholder return has matched the performance of the underlying business.
View our latest analysis for Doman Building Materials Group
To paraphrase Benjamin Graham: Over the short term the market is a voting machine, but over the long term it's a weighing machine. By comparing earnings per share (EPS) and share price changes over time, we can get a feel for how investor attitudes to a company have morphed over time.
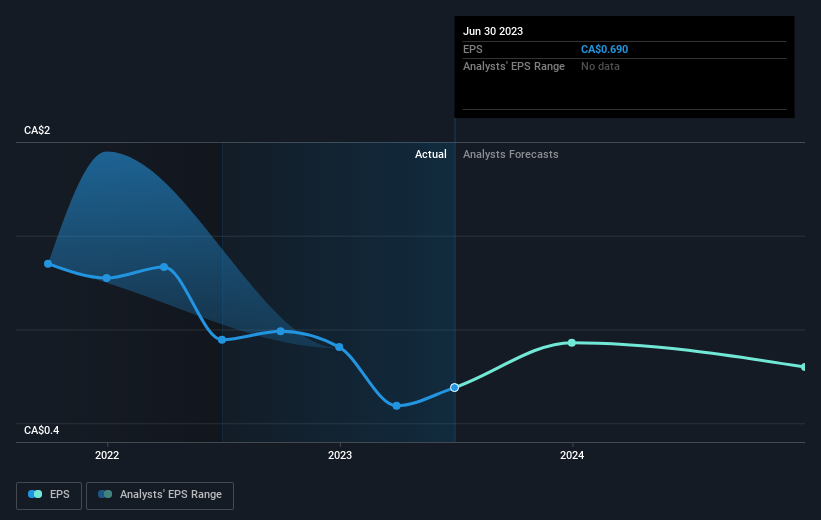
Over half a decade, Doman Building Materials Group managed to grow its earnings per share at 6.2% a year. So the EPS growth rate is rather close to the annualized share price gain of 8% per year. This indicates that investor sentiment towards the company has not changed a great deal. Indeed, it would appear the share price is reacting to the EPS.
The graphic below depicts how EPS has changed over time (unveil the exact values by clicking on the image).
We know that Doman Building Materials Group has improved its bottom line over the last three years, but what does the future have in store? You can see how its balance sheet has strengthened (or weakened) over time in this free interactive graphic.
What About Dividends?
As well as measuring the share price return, investors should also consider the total shareholder return (TSR). The TSR is a return calculation that accounts for the value of cash dividends (assuming that any dividend received was reinvested) and the calculated value of any discounted capital raisings and spin-offs. It's fair to say that the TSR gives a more complete picture for stocks that pay a dividend. As it happens, Doman Building Materials Group's TSR for the last 5 years was 128%, which exceeds the share price return mentioned earlier. The dividends paid by the company have thusly boosted the total shareholder return.
A Different Perspective
It's nice to see that Doman Building Materials Group shareholders have received a total shareholder return of 45% over the last year. And that does include the dividend. Since the one-year TSR is better than the five-year TSR (the latter coming in at 18% per year), it would seem that the stock's performance has improved in recent times. In the best case scenario, this may hint at some real business momentum, implying that now could be a great time to delve deeper. It's always interesting to track share price performance over the longer term. But to understand Doman Building Materials Group better, we need to consider many other factors. Take risks, for example - Doman Building Materials Group has 2 warning signs (and 1 which is a bit concerning) we think you should know about.
We will like Doman Building Materials Group better if we see some big insider buys. While we wait, check out this free list of growing companies with considerable, recent, insider buying.
Please note, the market returns quoted in this article reflect the market weighted average returns of stocks that currently trade on Canadian exchanges.
Have feedback on this article? Concerned about the content? Get in touch with us directly. Alternatively, email editorial-team (at) simplywallst.com.
This article by Simply Wall St is general in nature. We provide commentary based on historical data and analyst forecasts only using an unbiased methodology and our articles are not intended to be financial advice. It does not constitute a recommendation to buy or sell any stock, and does not take account of your objectives, or your financial situation. We aim to bring you long-term focused analysis driven by fundamental data. Note that our analysis may not factor in the latest price-sensitive company announcements or qualitative material. Simply Wall St has no position in any stocks mentioned.
