Those who invested in Dyadic International (NASDAQ:DYAI) five years ago are up 63%
Dyadic International, Inc. (NASDAQ:DYAI) shareholders might be concerned after seeing the share price drop 18% in the last quarter. While that's not great, the returns over five years have been decent. After all, the stock has performed better than the market (54%) in that time, and is up 63%. Unfortunately not all shareholders will have held it for the long term, so spare a thought for those caught in the 45% decline over the last twelve months.
Now it's worth having a look at the company's fundamentals too, because that will help us determine if the long term shareholder return has matched the performance of the underlying business.
View our latest analysis for Dyadic International
Dyadic International recorded just US$2,313,199 in revenue over the last twelve months, which isn't really enough for us to consider it to have a proven product. As a result, we think it's unlikely shareholders are paying much attention to current revenue, but rather speculating on growth in the years to come. For example, they may be hoping that Dyadic International comes up with a great new product, before it runs out of money.
Companies that lack both meaningful revenue and profits are usually considered high risk. There is almost always a chance they will need to raise more capital, and their progress - and share price - will dictate how dilutive that is to current holders. While some companies like this go on to deliver on their plan, making good money for shareholders, many end in painful losses and eventual de-listing. Some Dyadic International investors have already had a taste of the sweet taste stocks like this can leave in the mouth, as they gain popularity and attract speculative capital.
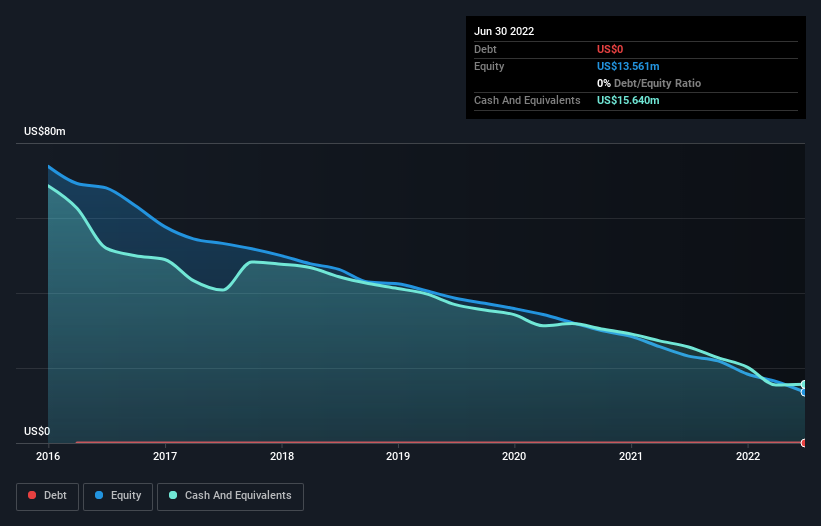
Dyadic International had cash in excess of all liabilities of US$12m when it last reported (June 2022). While that's nothing to panic about, there is some possibility the company will raise more capital, especially if profits are not imminent. Given the share price has increased by a solid 117% per year, over 5 years , it's fair to say investors remain excited about the future, despite the potential need for cash. You can click on the image below to see (in greater detail) how Dyadic International's cash levels have changed over time.
It can be extremely risky to invest in a company that doesn't even have revenue. There's no way to know its value easily. However you can take a look at whether insiders have been buying up shares. It's usually a positive if they have, as it may indicate they see value in the stock. You can click here to see if there are insiders buying.
A Different Perspective
While the broader market lost about 25% in the twelve months, Dyadic International shareholders did even worse, losing 45%. Having said that, it's inevitable that some stocks will be oversold in a falling market. The key is to keep your eyes on the fundamental developments. Longer term investors wouldn't be so upset, since they would have made 10%, each year, over five years. It could be that the recent sell-off is an opportunity, so it may be worth checking the fundamental data for signs of a long term growth trend. While it is well worth considering the different impacts that market conditions can have on the share price, there are other factors that are even more important. For instance, we've identified 4 warning signs for Dyadic International (1 is a bit concerning) that you should be aware of.
But note: Dyadic International may not be the best stock to buy. So take a peek at this free list of interesting companies with past earnings growth (and further growth forecast).
Please note, the market returns quoted in this article reflect the market weighted average returns of stocks that currently trade on US exchanges.
Have feedback on this article? Concerned about the content? Get in touch with us directly. Alternatively, email editorial-team (at) simplywallst.com.
This article by Simply Wall St is general in nature. We provide commentary based on historical data and analyst forecasts only using an unbiased methodology and our articles are not intended to be financial advice. It does not constitute a recommendation to buy or sell any stock, and does not take account of your objectives, or your financial situation. We aim to bring you long-term focused analysis driven by fundamental data. Note that our analysis may not factor in the latest price-sensitive company announcements or qualitative material. Simply Wall St has no position in any stocks mentioned.
Join A Paid User Research Session
You’ll receive a US$30 Amazon Gift card for 1 hour of your time while helping us build better investing tools for the individual investors like yourself. Sign up here
