Those who invested in Fastenal (NASDAQ:FAST) five years ago are up 180%
When you buy a stock there is always a possibility that it could drop 100%. But when you pick a company that is really flourishing, you can make more than 100%. For example, the Fastenal Company (NASDAQ:FAST) share price has soared 145% in the last half decade. Most would be very happy with that. Also pleasing for shareholders was the 17% gain in the last three months. But this could be related to the strong market, which is up 7.1% in the last three months.
With that in mind, it's worth seeing if the company's underlying fundamentals have been the driver of long term performance, or if there are some discrepancies.
View our latest analysis for Fastenal
While the efficient markets hypothesis continues to be taught by some, it has been proven that markets are over-reactive dynamic systems, and investors are not always rational. By comparing earnings per share (EPS) and share price changes over time, we can get a feel for how investor attitudes to a company have morphed over time.
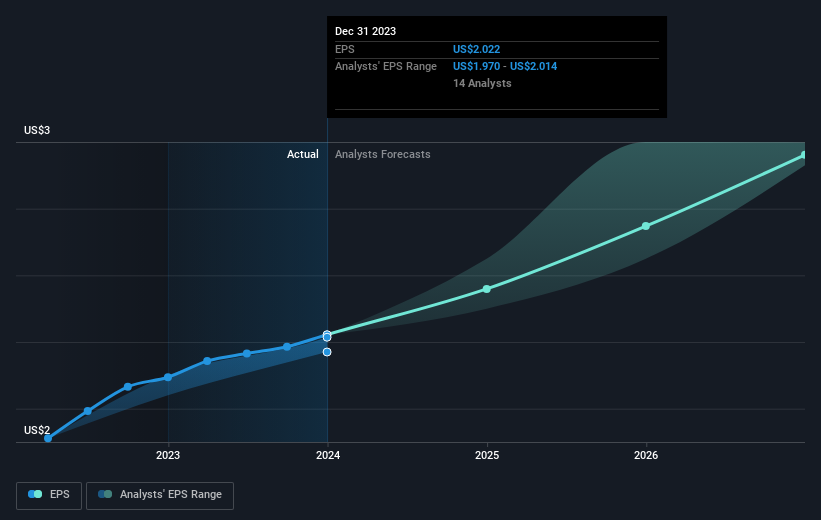
During five years of share price growth, Fastenal achieved compound earnings per share (EPS) growth of 9.0% per year. This EPS growth is lower than the 20% average annual increase in the share price. This suggests that market participants hold the company in higher regard, these days. And that's hardly shocking given the track record of growth.
The company's earnings per share (over time) is depicted in the image below (click to see the exact numbers).
It's probably worth noting that the CEO is paid less than the median at similar sized companies. But while CEO remuneration is always worth checking, the really important question is whether the company can grow earnings going forward. This free interactive report on Fastenal's earnings, revenue and cash flow is a great place to start, if you want to investigate the stock further.
What About Dividends?
It is important to consider the total shareholder return, as well as the share price return, for any given stock. The TSR is a return calculation that accounts for the value of cash dividends (assuming that any dividend received was reinvested) and the calculated value of any discounted capital raisings and spin-offs. It's fair to say that the TSR gives a more complete picture for stocks that pay a dividend. As it happens, Fastenal's TSR for the last 5 years was 180%, which exceeds the share price return mentioned earlier. And there's no prize for guessing that the dividend payments largely explain the divergence!
A Different Perspective
It's good to see that Fastenal has rewarded shareholders with a total shareholder return of 47% in the last twelve months. And that does include the dividend. Since the one-year TSR is better than the five-year TSR (the latter coming in at 23% per year), it would seem that the stock's performance has improved in recent times. Given the share price momentum remains strong, it might be worth taking a closer look at the stock, lest you miss an opportunity. If you would like to research Fastenal in more detail then you might want to take a look at whether insiders have been buying or selling shares in the company.
We will like Fastenal better if we see some big insider buys. While we wait, check out this free list of growing companies with considerable, recent, insider buying.
Please note, the market returns quoted in this article reflect the market weighted average returns of stocks that currently trade on American exchanges.
Have feedback on this article? Concerned about the content? Get in touch with us directly. Alternatively, email editorial-team (at) simplywallst.com.
This article by Simply Wall St is general in nature. We provide commentary based on historical data and analyst forecasts only using an unbiased methodology and our articles are not intended to be financial advice. It does not constitute a recommendation to buy or sell any stock, and does not take account of your objectives, or your financial situation. We aim to bring you long-term focused analysis driven by fundamental data. Note that our analysis may not factor in the latest price-sensitive company announcements or qualitative material. Simply Wall St has no position in any stocks mentioned.
