Those who invested in Hammond Power Solutions (TSE:HPS.A) three years ago are up 662%
Generally speaking, investors are inspired to be stock pickers by the potential to find the big winners. But when you hold the right stock for the right time period, the rewards can be truly huge. For example, the Hammond Power Solutions Inc. (TSE:HPS.A) share price is up a whopping 591% in the last three years, a handsome return for long term holders. Also pleasing for shareholders was the 68% gain in the last three months. This could be related to the recent financial results, released recently - you can catch up on the most recent data by reading our company report. We love happy stories like this one. The company should be really proud of that performance!
With that in mind, it's worth seeing if the company's underlying fundamentals have been the driver of long term performance, or if there are some discrepancies.
Check out our latest analysis for Hammond Power Solutions
While markets are a powerful pricing mechanism, share prices reflect investor sentiment, not just underlying business performance. By comparing earnings per share (EPS) and share price changes over time, we can get a feel for how investor attitudes to a company have morphed over time.
Hammond Power Solutions was able to grow its EPS at 59% per year over three years, sending the share price higher. In comparison, the 90% per year gain in the share price outpaces the EPS growth. So it's fair to assume the market has a higher opinion of the business than it did three years ago. That's not necessarily surprising considering the three-year track record of earnings growth.
You can see below how EPS has changed over time (discover the exact values by clicking on the image).
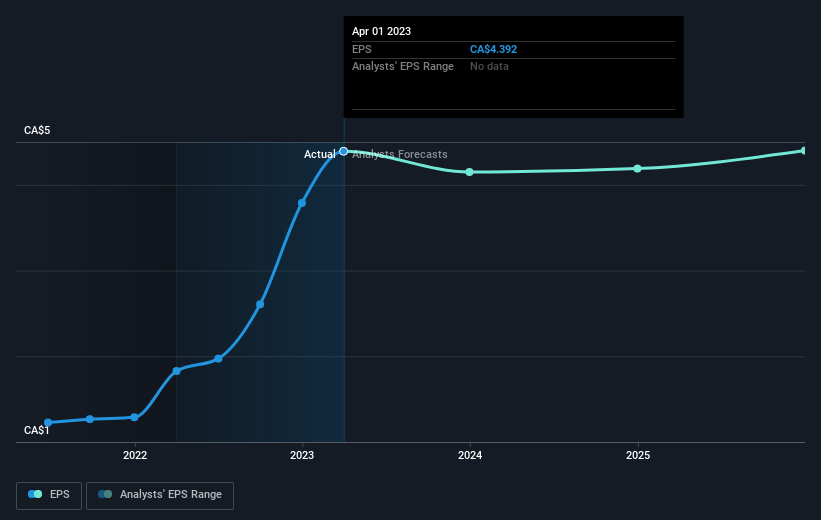
It is of course excellent to see how Hammond Power Solutions has grown profits over the years, but the future is more important for shareholders. If you are thinking of buying or selling Hammond Power Solutions stock, you should check out this FREE detailed report on its balance sheet.
What About Dividends?
As well as measuring the share price return, investors should also consider the total shareholder return (TSR). The TSR is a return calculation that accounts for the value of cash dividends (assuming that any dividend received was reinvested) and the calculated value of any discounted capital raisings and spin-offs. It's fair to say that the TSR gives a more complete picture for stocks that pay a dividend. As it happens, Hammond Power Solutions' TSR for the last 3 years was 662%, which exceeds the share price return mentioned earlier. And there's no prize for guessing that the dividend payments largely explain the divergence!
A Different Perspective
It's nice to see that Hammond Power Solutions shareholders have received a total shareholder return of 188% over the last year. That's including the dividend. Since the one-year TSR is better than the five-year TSR (the latter coming in at 39% per year), it would seem that the stock's performance has improved in recent times. Someone with an optimistic perspective could view the recent improvement in TSR as indicating that the business itself is getting better with time. It's always interesting to track share price performance over the longer term. But to understand Hammond Power Solutions better, we need to consider many other factors. Consider for instance, the ever-present spectre of investment risk. We've identified 2 warning signs with Hammond Power Solutions (at least 1 which can't be ignored) , and understanding them should be part of your investment process.
If you like to buy stocks alongside management, then you might just love this free list of companies. (Hint: insiders have been buying them).
Please note, the market returns quoted in this article reflect the market weighted average returns of stocks that currently trade on Canadian exchanges.
Have feedback on this article? Concerned about the content? Get in touch with us directly. Alternatively, email editorial-team (at) simplywallst.com.
This article by Simply Wall St is general in nature. We provide commentary based on historical data and analyst forecasts only using an unbiased methodology and our articles are not intended to be financial advice. It does not constitute a recommendation to buy or sell any stock, and does not take account of your objectives, or your financial situation. We aim to bring you long-term focused analysis driven by fundamental data. Note that our analysis may not factor in the latest price-sensitive company announcements or qualitative material. Simply Wall St has no position in any stocks mentioned.
Join A Paid User Research Session
You’ll receive a US$30 Amazon Gift card for 1 hour of your time while helping us build better investing tools for the individual investors like yourself. Sign up here
