Those who invested in Motus Holdings (JSE:MTH) three years ago are up 268%
It hasn't been the best quarter for Motus Holdings Limited (JSE:MTH) shareholders, since the share price has fallen 25% in that time. But in three years the returns have been great. The share price marched upwards over that time, and is now 219% higher than it was. It's not uncommon to see a share price retrace a bit, after a big gain. The fundamental business performance will ultimately dictate whether the top is in, or if this is a stellar buying opportunity.
Let's take a look at the underlying fundamentals over the longer term, and see if they've been consistent with shareholders returns.
Check out our latest analysis for Motus Holdings
To quote Buffett, 'Ships will sail around the world but the Flat Earth Society will flourish. There will continue to be wide discrepancies between price and value in the marketplace...' One flawed but reasonable way to assess how sentiment around a company has changed is to compare the earnings per share (EPS) with the share price.
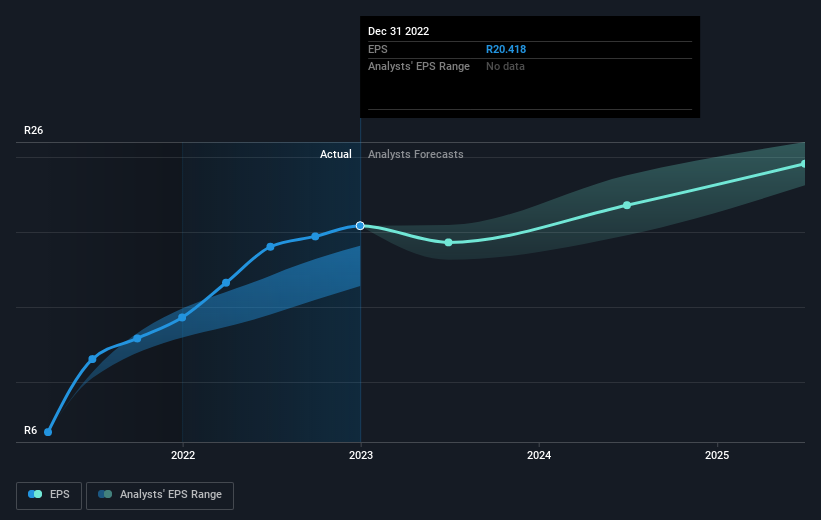
During three years of share price growth, Motus Holdings achieved compound earnings per share growth of 26% per year. This EPS growth is lower than the 47% average annual increase in the share price. This indicates that the market is feeling more optimistic on the stock, after the last few years of progress. That's not necessarily surprising considering the three-year track record of earnings growth.
The image below shows how EPS has tracked over time (if you click on the image you can see greater detail).
It's probably worth noting we've seen significant insider buying in the last quarter, which we consider a positive. On the other hand, we think the revenue and earnings trends are much more meaningful measures of the business. Dive deeper into the earnings by checking this interactive graph of Motus Holdings' earnings, revenue and cash flow.
What About Dividends?
It is important to consider the total shareholder return, as well as the share price return, for any given stock. Whereas the share price return only reflects the change in the share price, the TSR includes the value of dividends (assuming they were reinvested) and the benefit of any discounted capital raising or spin-off. So for companies that pay a generous dividend, the TSR is often a lot higher than the share price return. As it happens, Motus Holdings' TSR for the last 3 years was 268%, which exceeds the share price return mentioned earlier. This is largely a result of its dividend payments!
A Different Perspective
The last twelve months weren't great for Motus Holdings shares, which cost holders 9.2%, including dividends, while the market was up about 1.0%. However, keep in mind that even the best stocks will sometimes underperform the market over a twelve month period. Fortunately the longer term story is brighter, with total returns averaging about 54% per year over three years. Sometimes when a good quality long term winner has a weak period, it's turns out to be an opportunity, but you really need to be sure that the quality is there. I find it very interesting to look at share price over the long term as a proxy for business performance. But to truly gain insight, we need to consider other information, too. Like risks, for instance. Every company has them, and we've spotted 2 warning signs for Motus Holdings (of which 1 is significant!) you should know about.
Motus Holdings is not the only stock that insiders are buying. For those who like to find winning investments this free list of growing companies with recent insider purchasing, could be just the ticket.
Please note, the market returns quoted in this article reflect the market weighted average returns of stocks that currently trade on South African exchanges.
Have feedback on this article? Concerned about the content? Get in touch with us directly. Alternatively, email editorial-team (at) simplywallst.com.
This article by Simply Wall St is general in nature. We provide commentary based on historical data and analyst forecasts only using an unbiased methodology and our articles are not intended to be financial advice. It does not constitute a recommendation to buy or sell any stock, and does not take account of your objectives, or your financial situation. We aim to bring you long-term focused analysis driven by fundamental data. Note that our analysis may not factor in the latest price-sensitive company announcements or qualitative material. Simply Wall St has no position in any stocks mentioned.
Join A Paid User Research Session
You’ll receive a US$30 Amazon Gift card for 1 hour of your time while helping us build better investing tools for the individual investors like yourself. Sign up here
