Those who invested in National Grid (LON:NG.) five years ago are up 61%
National Grid plc (LON:NG.) shareholders have seen the share price descend 11% over the month. But that doesn't change the fact that the returns over the last five years have been pleasing. Its return of 24% has certainly bested the market return!
Now it's worth having a look at the company's fundamentals too, because that will help us determine if the long term shareholder return has matched the performance of the underlying business.
See our latest analysis for National Grid
There is no denying that markets are sometimes efficient, but prices do not always reflect underlying business performance. One way to examine how market sentiment has changed over time is to look at the interaction between a company's share price and its earnings per share (EPS).
National Grid's earnings per share are down 6.4% per year, despite strong share price performance over five years.
The strong decline in earnings per share suggests the market isn't using EPS to judge the company. Given that EPS is down, but the share price is up, it seems clear the market is focussed on other aspects of the business, at the moment.
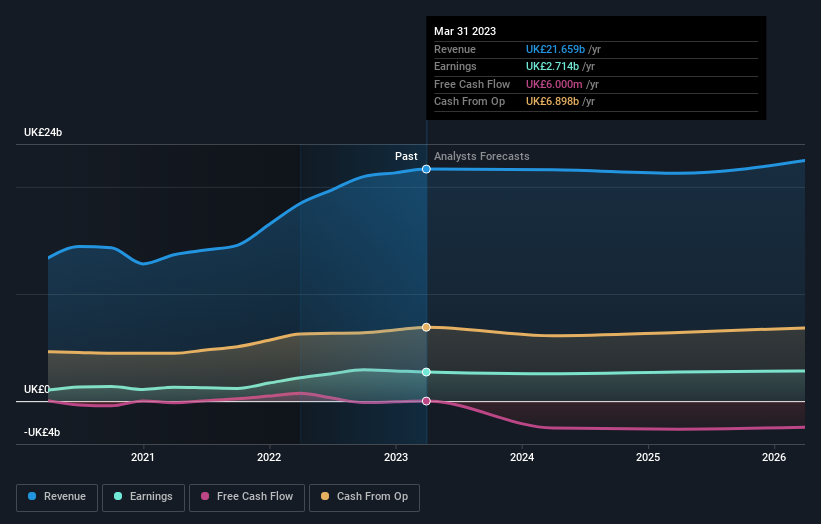
We note that the dividend is higher than it was previously - always nice to see. Maybe dividend investors have helped support the share price. We'd posit that the revenue growth over the last five years, of 7.4% per year, would encourage people to invest.
The graphic below depicts how earnings and revenue have changed over time (unveil the exact values by clicking on the image).
National Grid is well known by investors, and plenty of clever analysts have tried to predict the future profit levels. You can see what analysts are predicting for National Grid in this interactive graph of future profit estimates.
What About Dividends?
As well as measuring the share price return, investors should also consider the total shareholder return (TSR). The TSR is a return calculation that accounts for the value of cash dividends (assuming that any dividend received was reinvested) and the calculated value of any discounted capital raisings and spin-offs. Arguably, the TSR gives a more comprehensive picture of the return generated by a stock. As it happens, National Grid's TSR for the last 5 years was 61%, which exceeds the share price return mentioned earlier. And there's no prize for guessing that the dividend payments largely explain the divergence!
A Different Perspective
National Grid shareholders gained a total return of 2.7% during the year. Unfortunately this falls short of the market return. On the bright side, the longer term returns (running at about 10% a year, over half a decade) look better. It may well be that this is a business worth popping on the watching, given the continuing positive reception, over time, from the market. I find it very interesting to look at share price over the long term as a proxy for business performance. But to truly gain insight, we need to consider other information, too. For instance, we've identified 3 warning signs for National Grid (1 doesn't sit too well with us) that you should be aware of.
Of course, you might find a fantastic investment by looking elsewhere. So take a peek at this free list of companies we expect will grow earnings.
Please note, the market returns quoted in this article reflect the market weighted average returns of stocks that currently trade on British exchanges.
Have feedback on this article? Concerned about the content? Get in touch with us directly. Alternatively, email editorial-team (at) simplywallst.com.
This article by Simply Wall St is general in nature. We provide commentary based on historical data and analyst forecasts only using an unbiased methodology and our articles are not intended to be financial advice. It does not constitute a recommendation to buy or sell any stock, and does not take account of your objectives, or your financial situation. We aim to bring you long-term focused analysis driven by fundamental data. Note that our analysis may not factor in the latest price-sensitive company announcements or qualitative material. Simply Wall St has no position in any stocks mentioned.
Join A Paid User Research Session
You’ll receive a US$30 Amazon Gift card for 1 hour of your time while helping us build better investing tools for the individual investors like yourself. Sign up here
