Those who invested in Spectrum Brands Holdings (NYSE:SPB) five years ago are up 69%
When you buy and hold a stock for the long term, you definitely want it to provide a positive return. Better yet, you'd like to see the share price move up more than the market average. But Spectrum Brands Holdings, Inc. (NYSE:SPB) has fallen short of that second goal, with a share price rise of 49% over five years, which is below the market return. On a brighter note, more newer shareholders are probably rather content with the 47% share price gain over twelve months.
So let's investigate and see if the longer term performance of the company has been in line with the underlying business' progress.
Check out our latest analysis for Spectrum Brands Holdings
While markets are a powerful pricing mechanism, share prices reflect investor sentiment, not just underlying business performance. One way to examine how market sentiment has changed over time is to look at the interaction between a company's share price and its earnings per share (EPS).
We know that Spectrum Brands Holdings has been profitable in the past. On the other hand, it reported a trailing twelve months loss, suggesting it isn't reliably profitable. So it might be better to look at other metrics to try to understand the share price.
We doubt the modest 2.0% dividend yield is attracting many buyers to the stock. It is not great to see that revenue has dropped by 4.5% per year over five years. So it seems one might have to take closer look at earnings and revenue trends to see how they might influence the share price.
The image below shows how earnings and revenue have tracked over time (if you click on the image you can see greater detail).
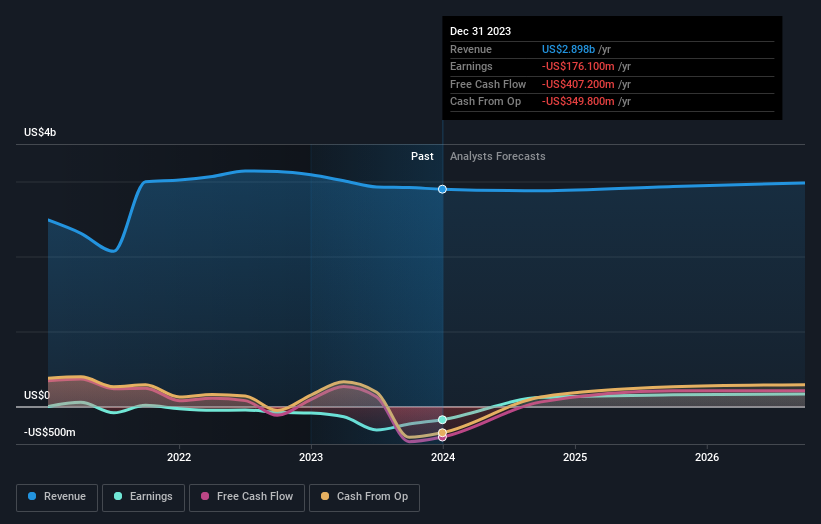
We like that insiders have been buying shares in the last twelve months. Having said that, most people consider earnings and revenue growth trends to be a more meaningful guide to the business. You can see what analysts are predicting for Spectrum Brands Holdings in this interactive graph of future profit estimates.
What About Dividends?
It is important to consider the total shareholder return, as well as the share price return, for any given stock. The TSR is a return calculation that accounts for the value of cash dividends (assuming that any dividend received was reinvested) and the calculated value of any discounted capital raisings and spin-offs. Arguably, the TSR gives a more comprehensive picture of the return generated by a stock. As it happens, Spectrum Brands Holdings' TSR for the last 5 years was 69%, which exceeds the share price return mentioned earlier. This is largely a result of its dividend payments!
A Different Perspective
It's good to see that Spectrum Brands Holdings has rewarded shareholders with a total shareholder return of 50% in the last twelve months. And that does include the dividend. That's better than the annualised return of 11% over half a decade, implying that the company is doing better recently. In the best case scenario, this may hint at some real business momentum, implying that now could be a great time to delve deeper. I find it very interesting to look at share price over the long term as a proxy for business performance. But to truly gain insight, we need to consider other information, too. For example, we've discovered 1 warning sign for Spectrum Brands Holdings that you should be aware of before investing here.
There are plenty of other companies that have insiders buying up shares. You probably do not want to miss this free list of growing companies that insiders are buying.
Please note, the market returns quoted in this article reflect the market weighted average returns of stocks that currently trade on American exchanges.
Have feedback on this article? Concerned about the content? Get in touch with us directly. Alternatively, email editorial-team (at) simplywallst.com.
This article by Simply Wall St is general in nature. We provide commentary based on historical data and analyst forecasts only using an unbiased methodology and our articles are not intended to be financial advice. It does not constitute a recommendation to buy or sell any stock, and does not take account of your objectives, or your financial situation. We aim to bring you long-term focused analysis driven by fundamental data. Note that our analysis may not factor in the latest price-sensitive company announcements or qualitative material. Simply Wall St has no position in any stocks mentioned.
